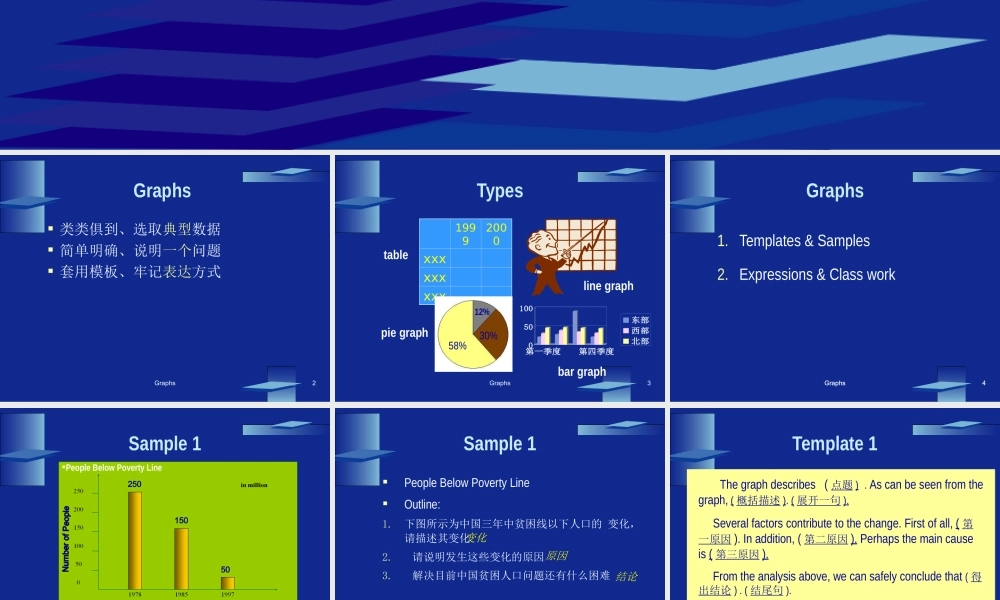
图表作文Graphs2Graphs 类类俱到、选取典型数据 简单明确、说明一个问题 套用模板、牢记表达方式Graphs3Types19992000xxxxxxxxx050100第一季度第四季度东部西部北部58%30%12%tableline graphpie graphbar graphGraphs4Graphs1. Templates & Samples 2. Expressions & Class workGraphs4Graphs5Sample 1YearYearNumber of PeopleNumber of People25015050People Below Poverty LineGraphs6Sample 1People Below Poverty Line Outline:1.
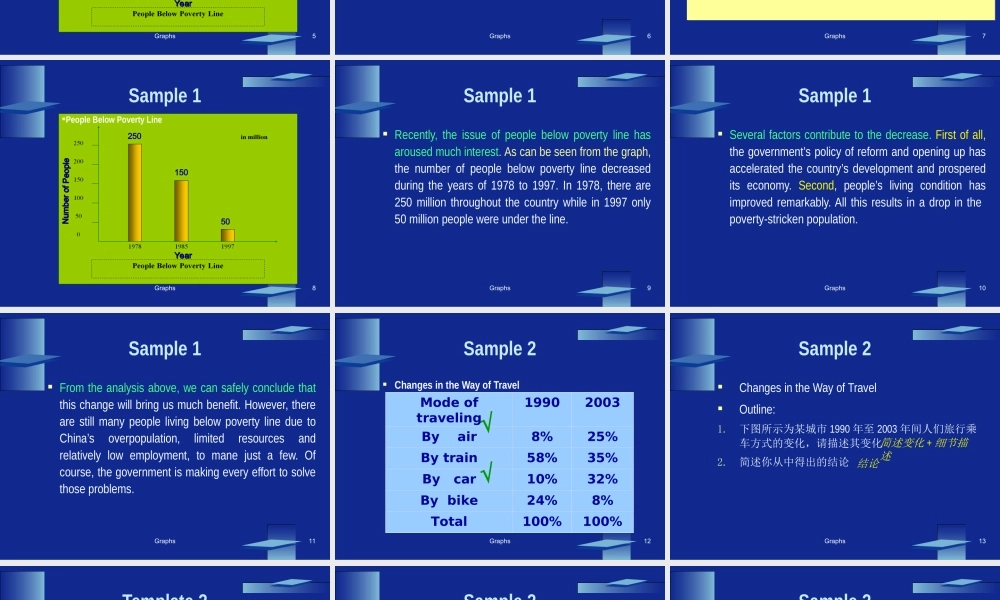
下图所示为中国三年中贫困线以下人口的 变化,请描述其变化2. 请说明发生这些变化的原因3. 解决目前中国贫困人口问题还有什么困难变化原因结论Graphs7Template 1 The graph describes ( 点题 ) . As can be seen from the graph, ( 概括描述 ). ( 展开一句 ). Several factors contribute to the change. First of all, ( 第一原因 ). In addition, ( 第二原因 ). Perhaps the main cause is ( 第三原因 ). From the analysis above, we can safely conclude that ( 得出结论 ) . ( 结尾句 ).Graphs8Sample 1YearYearNumber of PeopleNumber of People25015050People Below Poverty LineGraphs9Sample 1 Recently, the issue of people below poverty line has aroused much interest. As can be seen from the graph, the number of people below poverty line decreased during the years of 1978 to 1997. In 1978, there are 250 million throughout the country while in 1997 only 50 million people were under the line.Graphs10Sample 1 Several factors contribute to the decrease. First of all, the government’s policy of reform and opening up has accelerated the country’s development and prospered its economy. Second, people’s living condition has improved remarkably. All this results in a drop in the poverty-stricken population.Graphs11Sample 1 From the analysis above, we can safely conclude that this change will bring us much benefit. However, there are still many people living below povert...