精品文档---下载后可任意编辑【说明】下面的多元统计分析练习题摘自 R
Johnson 等编写的《应用多元统计分析(第五版)》,原书为:Richard A
Johnson and Dean W
Wichern
Applied Multivariate Statistical Analysis (5th Ed)
Pearson Education, Inc
我看的是中国统计出版社(China Statistics Press)2024 年发行的影印本
第一题为原书第 1
6 题,即第 1 章的第 6 题,第二题为原书第 8
12 题,即第 8 章的第 12 题
第二题用的是第一题的数据
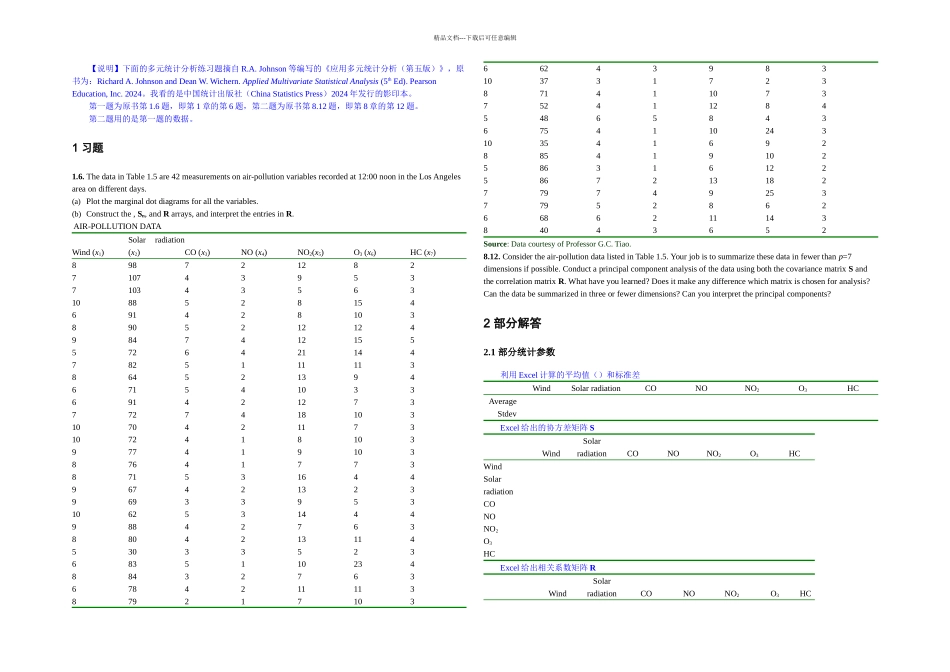
The data in Table 1
5 are 42 measurements on air-pollution variables recorded at 12:00 noon in the Los Angeles area on different days
(a) Plot the marginal dot diagrams for all the variables
(b) Construct the , Sn, and R arrays, and interpret the entries in R
AIR-POLLUTION DATAWind (x1)Solar radiation (x2)CO (x3)NO (x4)NO2(x5)O3 (x6)HC (x7)8987212827107439537103435631088528154691428103890521212498474121555726421144782511111386452139467154103369142127377274181031070421173107241