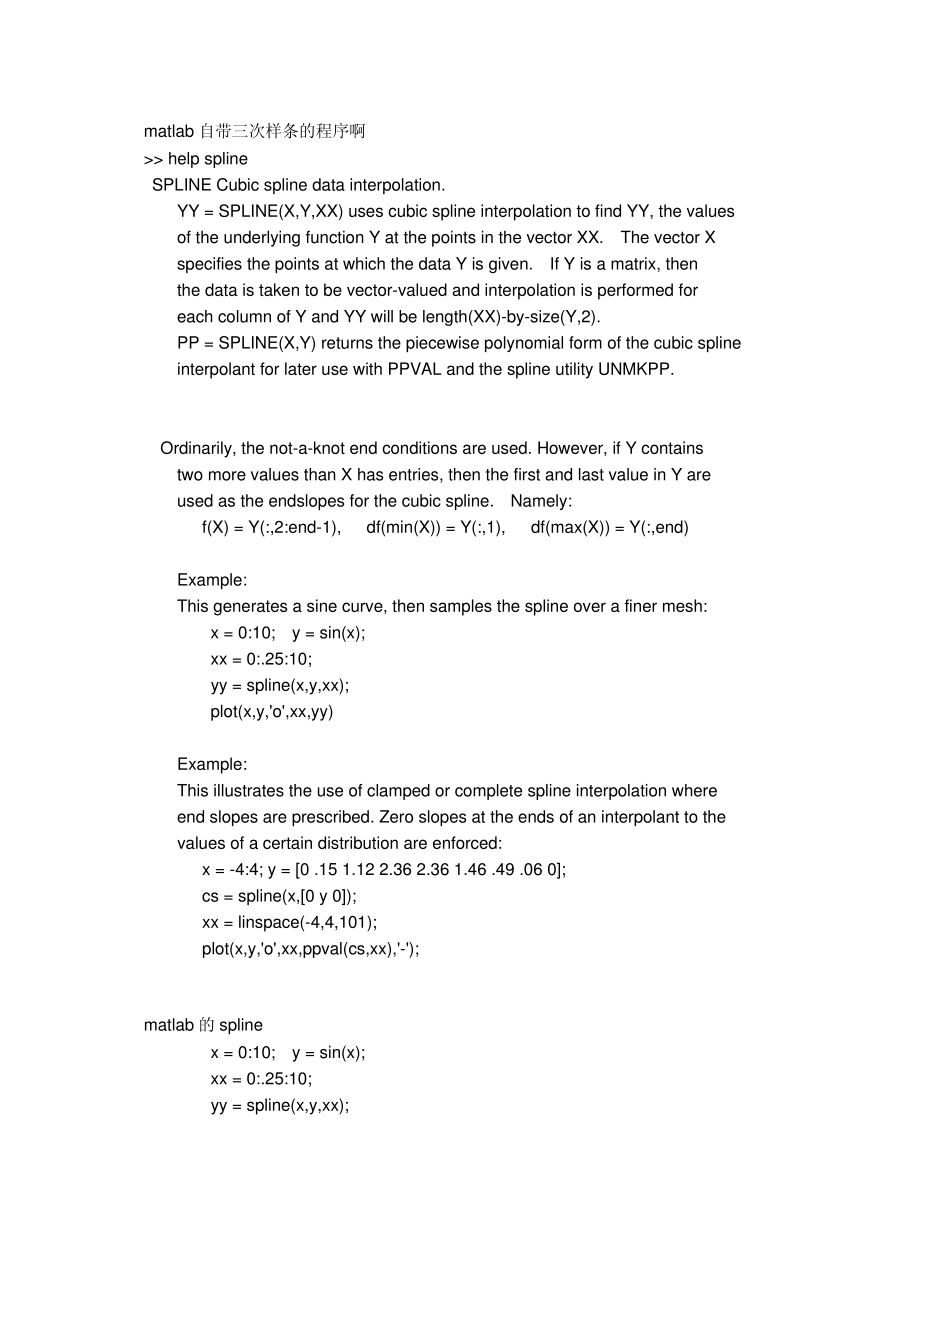
matlab 自带三次样条的程序啊 >> help spline SPLINE Cubic spline data interpolation. YY = SPLINE(X,Y,XX) uses cubic spline interpolation to find YY, the values of the underlying function Y at the points in the vector XX. The vector X specifies the points at which the data Y is given. If Y is a matrix, then the data is taken to be vector-valued and interpolation is performed for each column of Y and YY will be length(XX)-by-size(Y,2). PP = SPLINE(X,Y) returns the piecewise polynomial form of the cubic spline interpolant for later use with PPVAL and the spline utility UNMKPP. Ordinarily, the not-a-knot end conditions are used. However, if Y contains two more values than X has entries, then the first and last value in Y are used as the endslopes for the cubic spline. Namely: f(X) = Y(:,2:end-1), df(min(X)) = Y(:,1), df(max(X)) = Y(:,end) Example: This generates a sine curve, then samples the spline over a finer mesh: x = 0:10; y = sin(x); xx = 0:.25:10; yy = spline(x,y,xx); plot(x,y,'o',xx,yy) Example: This illustrates the use of clamped or complete spline interpolation where end slopes are prescribed. Zero slopes at the ends of an interpolant to the values of a certain distribution are enforced: x = -4:4; y = [0 .15 1.12 2.36 2.36 1.46 .49 .06 0]; cs = spline(x,[0 y 0]); xx = linspace(-4,4,101); plot(x,y,'o',xx,ppval(cs,xx),'-'); See also INTERP1, PPVAL, SPLINES (The Spline Toolbox). matlab 的 spline x = 0:10; y = sin(x); xx = 0:.25:10; yy = spline(x,y,xx); plot(x,y,'o',xx,yy) RT,已知条件是x =[0,1,2,3,4,5,6,7,8,9,10], y =[0,0.79,1.53,2.19,2.71,3.03,3.27,2.89,3.06,3.19,3.29]; 边界条件是f'(0)=0.8,f'(10)=0.2,要求的是具体的表达式,y =f(x ), spline 函数可以实现三次样条插值 x = 0:10; y = sin(x ); x x = 0:.25...


