图表描述专题训练(一)这类作文时,注意以下几点:第一,审题时,除了要把握好图表的表层信息外,还要分析图标的深层含义,如原因、根源、可能的发展趋势等
图表中所提供的说明文字往往是问题的切入点,一定要仔细分析
第二,描述数据时要抓住重点,为中心服务,不必面面俱到,切忌毫无目的地罗列图表中的数据
如果数据较多,抓住图表中的极端点(如最大或最小、最多或最少,最好或最差)和基本相同进行描述
第三,主题句应明确,最好放在文章的开头,这样会使重点突出,主题明了
图表范例一StudentsUseofComputers例文:StudentsUseofComputers提纲:1
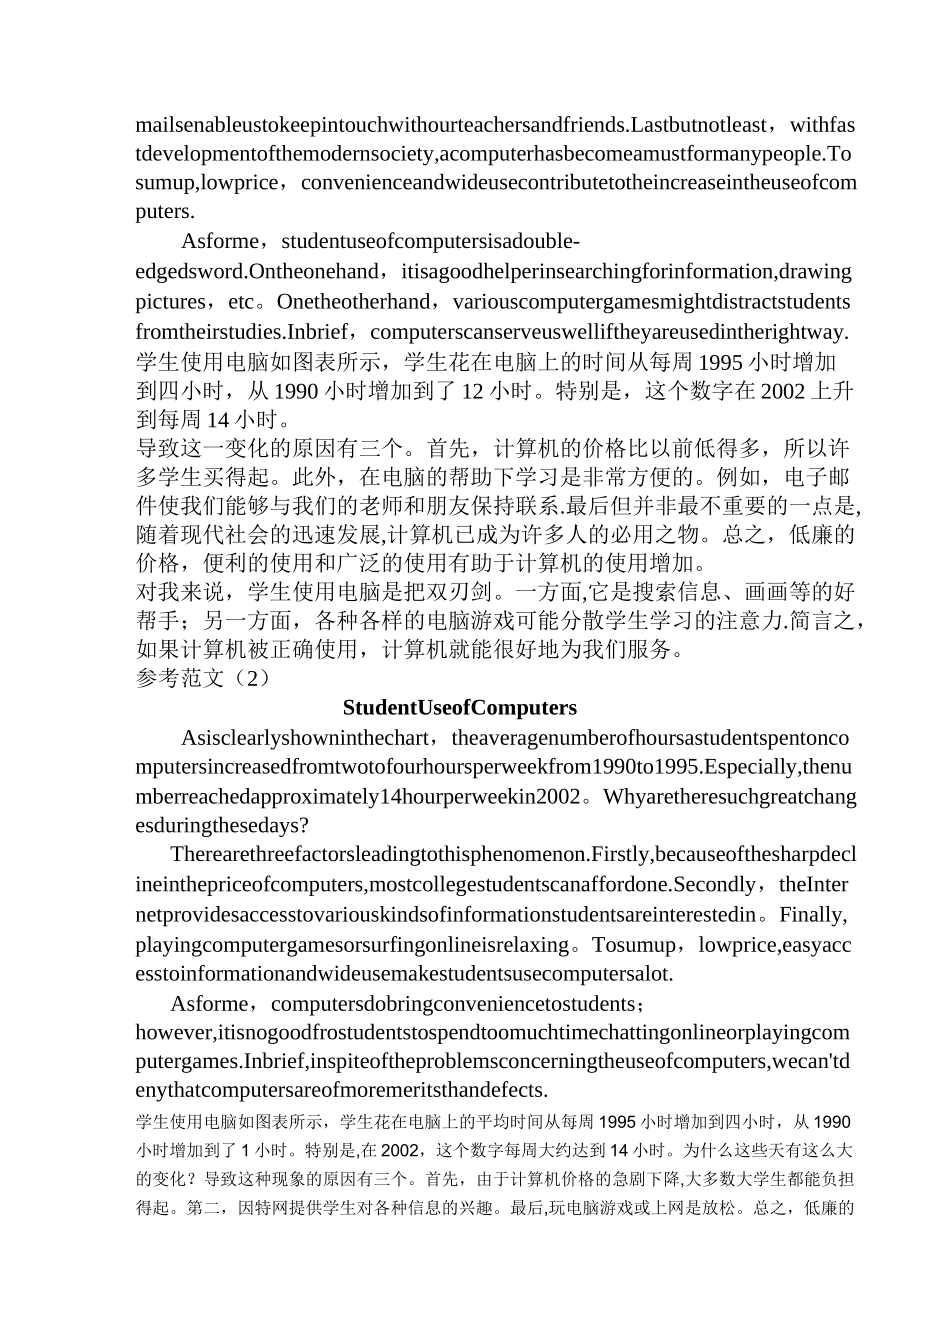
上图所示为某校大学生平均每周使用计算机的时间:1990 年(2hours),1995 年(4hours),2002 年(14hours),请描述其变化;2
请说明发生这些变化的原因(可从计算机的用途、价格或社会发展等方面加以说明);3
你认为目前大学生在计算机使用中有什么困难或问题
参考范文(1)StudentUseofComputersAsisclearlyshowninthechart,thenumberofhoursstudentsspentoncomputersincreasedfromtwotofourhoursperweekfrom1990to1995
Especially,thenumberrosetoabout14hourperweekin2002
Therearethreefactorsleadingtothechange
Tobeginwith,thepriceofcomputersisgettingmuchlowerthanbeforesothatmanystudentscanaffordit
Inaddition,itisveryconvenientforustostudywiththehelp