第12讲程向红最小相位系统和非最小相位系统伯特图求参数典型环节的极坐标图1第一页,共五十六页
第5章线性系统的频域分析法Frequency-responseanalysis应用频率特性研究线性系统的经典方法称为频域分析法
2第二页,共五十六页
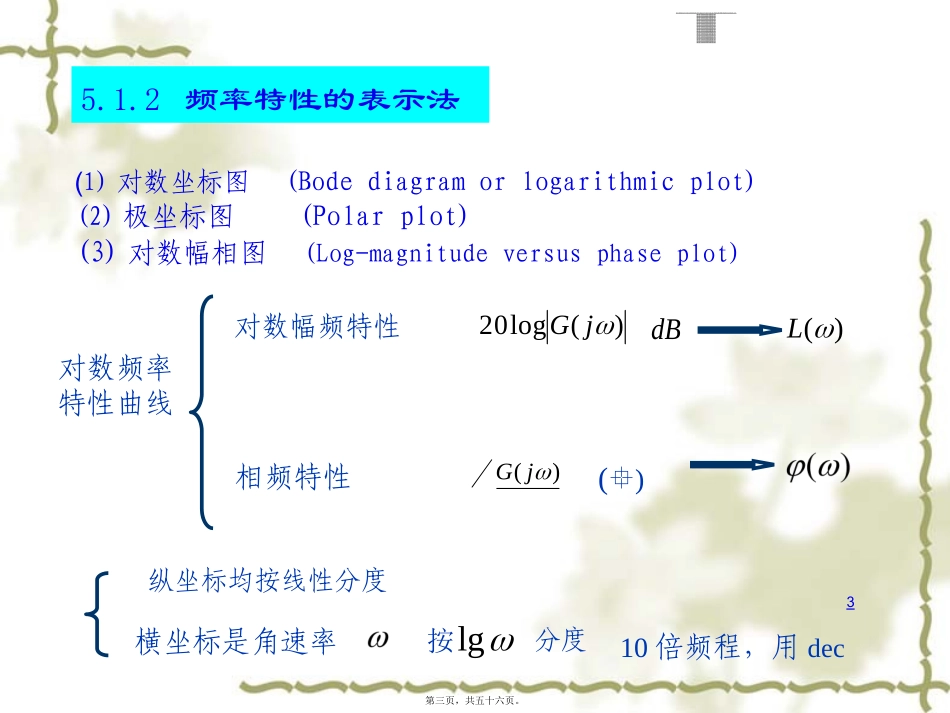
2频率特性的表示法(1)对数坐标图(Bodediagramorlogarithmicplot)(2)极坐标图(Polarplot)(3)对数幅相图(Log-magnitudeversusphaseplot)对数频率特性曲线)(log20jGdB)(L对数幅频特性相频特性()纵坐标均按线性分度横坐标是角速率)(jG10倍频程,用declg按分度3www
hzdiyan
comwww
sysmk120
comwww
qcxgqt
comwww
comhttp://sj
net/dxhttp://www
tuloutours
com/http://sj
net/dx/150611/4638157
htmlhttp://sj
net/dx/150611/4638167
htmlhttp://sj
net/dx/150611/4638168
htmlhttp://sj
net/dx/150611/4638191
htmlhttp://sj
net/dx/150612/4638729
htmlhttp://sj
net/dx/150613/4639076
htmlhttp://sj
net/dx/150614/4639161
htmlhttp://sj
net/dx/150614/4639162
htmlhttp://sj
net/dx/150614/4639176
htmlhttp://sj
net/dx/150615/4639665
htmlhtt