小作文折线1
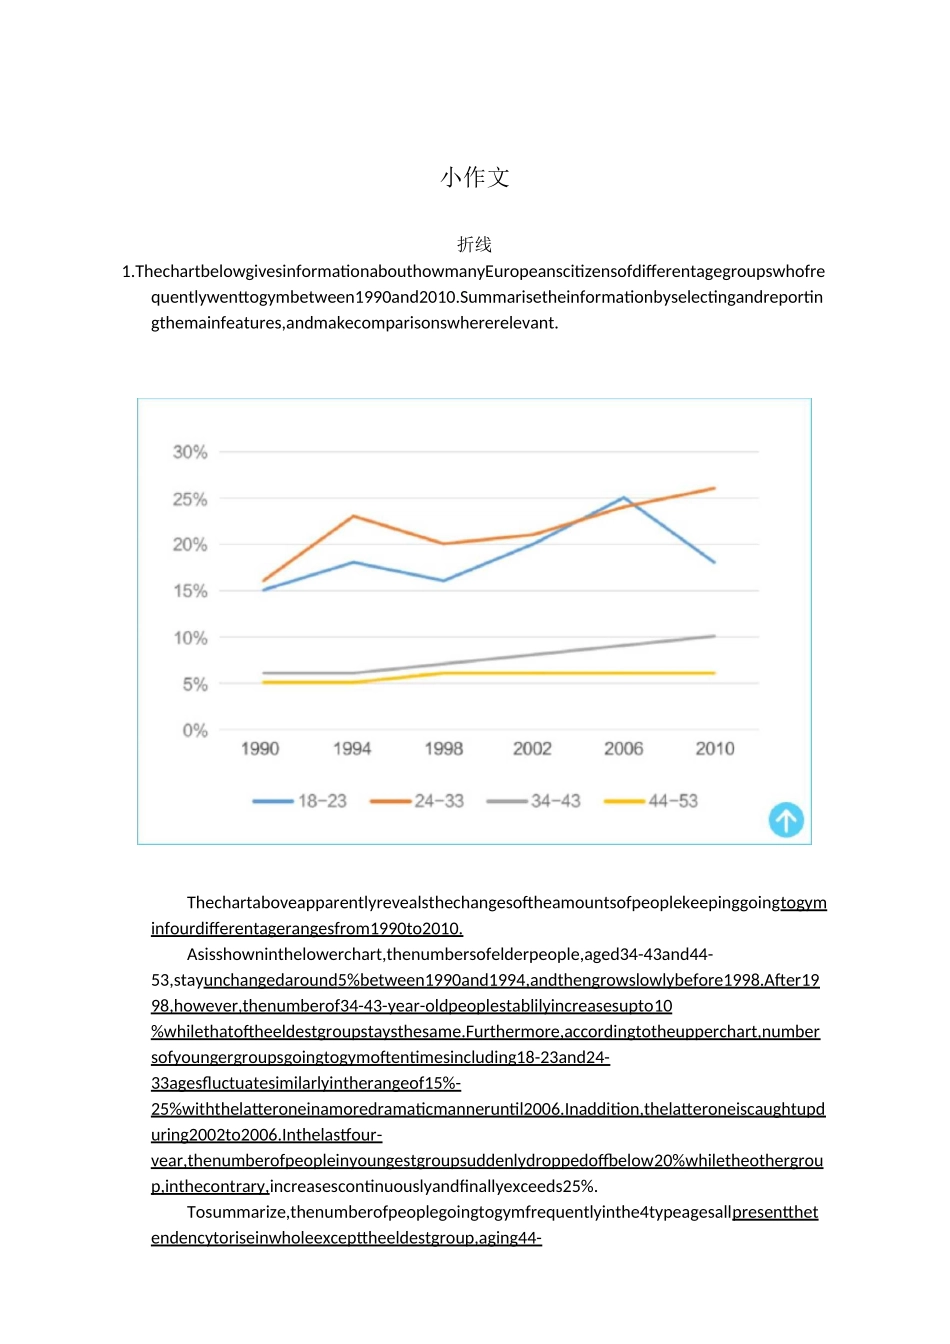
ThechartbelowgivesinformationabouthowmanyEuropeanscitizensofdifferentagegroupswhofrequentlywenttogymbetween1990and2010
Summarisetheinformationbyselectingandreportingthemainfeatures,andmakecomparisonswhererelevant
Thechartaboveapparentlyrevealsthechangesoftheamountsofpeoplekeepinggoingtogyminfourdifferentagerangesfrom1990to2010
Asisshowninthelowerchart,thenumbersofelderpeople,aged34-43and44-53,stayunchangedaround 5% between1990and1994,andthengrowslowlybefore1998
After19 98,however,thenumberof34-43-year-oldpeoplestablilyincreasesupto 10 % whilethatoftheeldestgroupstaysthesame
Furthermore,accordingtotheupperchart,number sofyoungergroupsgoingtogymoftentimesincluding18-23and24-33agesfluctuatesimilarlyintherangeof15%-25%withthelatteroneinamoredramaticmanneruntil2006
Inaddition,thelatteron