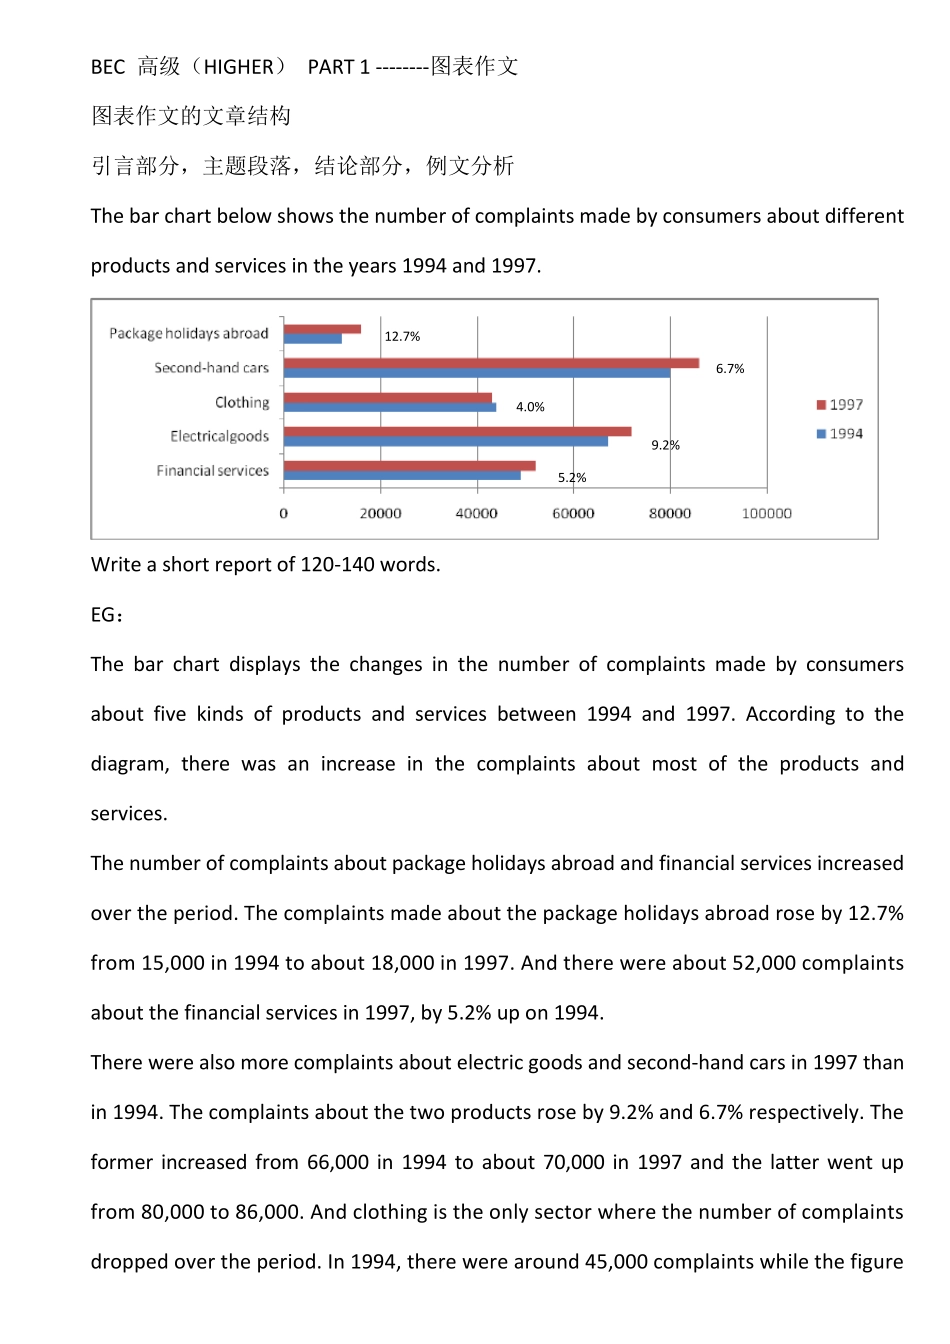
BEC 高级(HIGHER) PART 1 --------图表作文 图表作文的文章结构 引言部分,主题段落,结论部分,例文分析 The bar chart below shows the number of complaints made by consumers about different products and services in the years 1994 and 1997. Write a short report of 120-140 words. EG: The bar chart displays the changes in the number of complaints made by consumers about five kinds of products and services between 1994 and 1997. According to the diagram, there was an increase in the complaints about most of the products and services. The number of complaints about package holidays abroad and financial services increased over the period. The complaints made about the package holidays abroad rose by 12.7% from 15,000 in 1994 to about 18,000 in 1997. And there were about 52,000 complaints about the financial services in 1997, by 5.2% up on 1994. There were also more complaints about electric goods and second-hand cars in 1997 than in 1994. The complaints about the two products rose by 9.2% and 6.7% respectively. The former increased from 66,000 in 1994 to about 70,000 in 1997 and the latter went up from 80,000 to 86,000. And clothing is the only sector where the number of complaints dropped over the period. In 1994, there were around 45,000 complaints while the figure 12.7% 6.7% 4.0%9.2%5.2%decreased by 4% to around 43,000 in 1997. In conclusion, we can see there were more complaints about the products and services in 1997 than in 1994 with the only exception of clothing. 图表作文常用的语言手段 作文的开头------表示“出处”的句子结构 描述“数据变化”常用的表达方式 表示变化的副词和形容词 描述“数据”的表达方式 “大约”的表达方式 例一 The graph below shows development in the ownership of mobile telephones as a percenta...