精品文档---下载后可任意编辑Date:2024-02-25 04:56The Unity Profiler helps you to optimize your game
It reports for you how much time is spent in the various areas of your game
For example, it can report the percentage of time spent rendering, animating or in your game logic
Unity 分析器可以帮助你优化你的游戏
它为您报告在你的游戏的各个领域所花费的时间
例如,它可以报告渲染、动画或在你的游戏逻辑花费时间的百分比
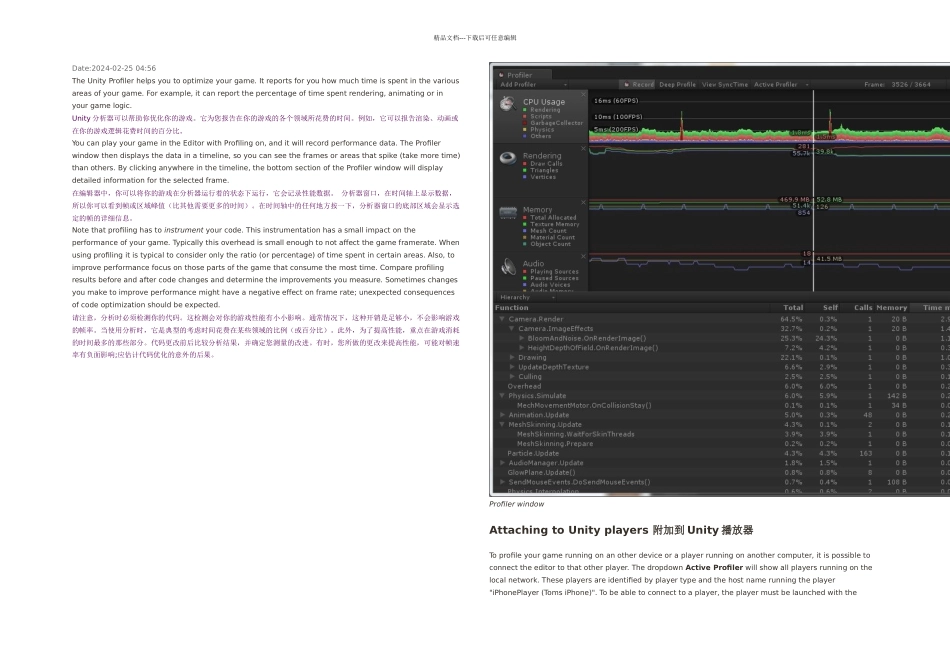
You can play your game in the Editor with Profiling on, and it will record performance data
The Profiler window then displays the data in a timeline, so you can see the frames or areas that spike (take more time) than others
By clicking anywhere in the timeline, the bottom section of the Profiler window will display detailed information for the selected frame
在编辑器中,你可以将你的游戏在分析器运行着的状态下运行,它会记录性能数据
分析器窗口,在时间轴上显示数据,所以你可以看到帧或区域峰值(比其他需要更多的时间)
在时间轴中的任何地方按一下,分析器窗口