电脑桌面
添加小米粒文库到电脑桌面
安装后可以在桌面快捷访问

雅思小作文柱图表图写作VIP免费

雅思小作文柱图表图写作_第1页
1/96
雅思小作文柱图表图写作_第2页
2/96
雅思小作文柱图表图写作_第3页
3/96
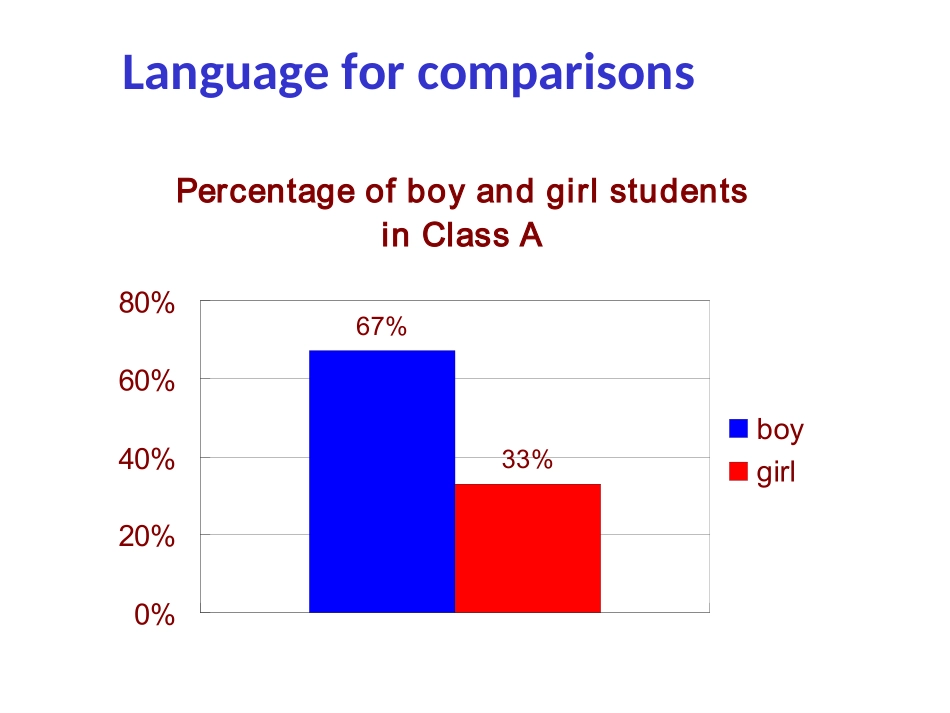
IELTSWRITINGTask1CHERYLXIAMENNEWORIENTALSCHOOLIELTSINTERNATIONALLEARNINGCENTRE各种图各种写LanguageforcomparisonsPercentageofboyandgirlstudentsinClassA67%33%0%20%40%60%80%boygirlLanguageforcomparisons67%33%0%20%40%60%80%boygirlmorethanTherearemoreboysthangirlsinclassA.ClassAhasfewergirlsthanboys.fewerthanLanguageforcomparisons67%33%0%20%40%60%80%boygirlthenumberofThenumberofboysislarger/greater/higherthanthatofgirlsinclassA.Languageforcomparisons67%33%0%20%40%60%80%boygirlthepercentageofThepercentageofboysislarger/greater/higherthanthatofgirlsinclassA(67%and33%,respectively).Languageforcomparisons67%33%0%20%40%60%80%boygirloutnumberBoysoutnumbergirlsinclassA.exceedThenumberofboysexceedsthatofgirlsinclassA.ThegraphbelowshowsthedifferentmodesoftransportusedtotraveltoandfromworkinoneEuropeancityin1960,1980and2000.P1•Thebargraphshowsthechangingpatternsincommutingbytrain,car,tubeorbusforcommutersinoneEuropeancityintheyears1960,1980and2000.P2•Thenumberofpeopleusingtrainsatfirstrosefromjustunder20%in1960toabout26%in1980,butthenfellbacktoabout23%in2000.•Useofthetubewasrelativelystable,fallingfrom27%ofcommutersin1960to22%in1980,butclimbingbacktoreach25%by2000.P3•Ontheotherhand,theuseofcarsincreasedsteadilyfromjustover5%in1960to23%in1980,reachingalmost40%by2000,•whereasthepopularityofbuseshasdeclinedsince1960,fallingfromjustunder35%in1960to27%in1980andonly15%in2000.P4•Thegraphindicatesthegrowinguseofcarsforcommutingtoworkbetween1960-2000,andthecontinueddeclineinthepopularityofbusesfrombeingthemostpopularmodeoftransportin1960totheleastpopularin2000.ThegraphbelowshowsthedifferentmodesoftransportusedtotraveltoandfromworkinoneEuropeancityin1960,1980and2000.Train,20%Car,5%Tube,30%Bus,40%TrainCarTubeBusTrain,28%Car,22%Tube,21%Bus,27%TrainCarTubeBus1960Train,21%Car,38%Tube,25%Bus,15%TrainCarTubeBus19802000•In1960,buswasthemostpopulartypeoftransportationmode,having40%commuters,whichwasfollowedbytube,trainandcarat27%,18%and6%respectively.•Twentyyearslater,thebiggestpercentagewenttotrainat28%.Interestingly,peopleusecarandtubesharedthesameproportion(about22percent).•Attheendof21stcentury,carbecamethemostpopularchoice,whichmeant37%peoplewouldcatchacabwhentheychosetoworkfromwork.Thechartsbelowshowthemainreasonsforstudyamongstudentsofdifferentagegroupsandtheamountofsupporttheyreceivedfromemployers.Thefirstgraphshowsthatthereisagradualdecreaseinstudyforcareerreasonswithage.Nearly80%ofstudentsunder26years,studyfortheircareer.Thispercentagegraduallydeclinesby10-20%everydecade.Only40%of40-49yroldsand18%ofover49yroldsstudyingforcareerreasonsinlateadulthood.Conversely,thefirstgraphalsoshowsthatstudystemmingfrominterestincreaseswithage.Thereareonly10%ofunder26yroldsstudyingoutofinterest.Thepercentageincreasesslowlytillthebeginningofthefourthdecade,andincreasesdramaticallyinlateadulthood.Nearlysamenumberof40-49yroldsstudyforcareerandinterest.However70%ofover49yroldsstudyforinterestincomparisonto18%studyingforcareerreasonsinthatagegroup.Thesecondgraphshowsthatemployersupportismaximum(approximately60%)fortheunder26yrstudents.Itdropsrapidlyto32%uptothethirddecadeoflife,andthenincreasesinlateadulthooduptoabout44%.Itisunclearwhetheremployersupportisonlyforcareer-focusedstudy,butthehighestlevelisforthosestudentswhomainlystudyforcareerpurposes.Thechartshowsthenumberofmobilephonesandlandlinespe...

1、当您付费下载文档后,您只拥有了使用权限,并不意味着购买了版权,文档只能用于自身使用,不得用于其他商业用途(如 [转卖]进行直接盈利或[编辑后售卖]进行间接盈利)。
2、本站所有内容均由合作方或网友上传,本站不对文档的完整性、权威性及其观点立场正确性做任何保证或承诺!文档内容仅供研究参考,付费前请自行鉴别。
3、如文档内容存在违规,或者侵犯商业秘密、侵犯著作权等,请点击“违规举报”。

碎片内容

雅思小作文柱图表图写作

确认删除?
VIP
微信客服
  • 扫码咨询
会员Q群
  • 会员专属群点击这里加入QQ群
客服邮箱
回到顶部