图表式作文的几种形式 :一是以表格形式 , 将统计的数据或被说明的事物直接用表格形式体现出来 , 即统计表
二是以图形形式 A 表示数据变化的曲线图 ; B 表示数据的大小或数量之间的差异 的条形图 ; C 表示总体内部结构变化的扇形图
Item20002002200420062008Food65%60%48%42%35%Clothing8%9%12%15%17%Recreation3%5%7%8%10%Others24%26%33%35%38%Total100%100%100%100%100%Table矩形的竖行和横行进行排列的表格 表格 Line Graph表示两组数的关系 - 通常为函数关系图曲线图 Bar Chart / Graph 柱形图 / 条形图 Pie Chart饼状图 图表式作文写作分三步 :第一步:开门见山地点明本图表所反映的主题常使用的词汇有 :table, chart, figure, graph, describe// tell, show, represent 等常用句型:1
The graph/chart/table above shows …2
From the above graph/chart, it can be seen that
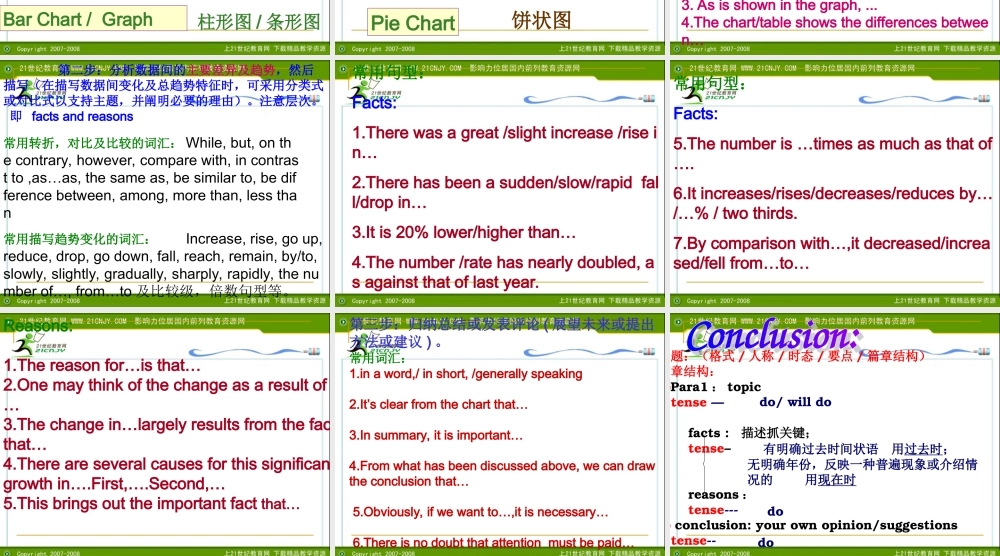
As is shown in the graph,
The chart/table shows the differences between… 第二步:分析数据间的主要差异及趋势,然后描写(在描写数据间变化及总趋势特征时,可采用分类式或对比式以支持主题,并阐明必要的理由)
即 facts and reasons常用转折,对比及比较的词汇: While, but, on the contrary, however, compare with, in contrast to