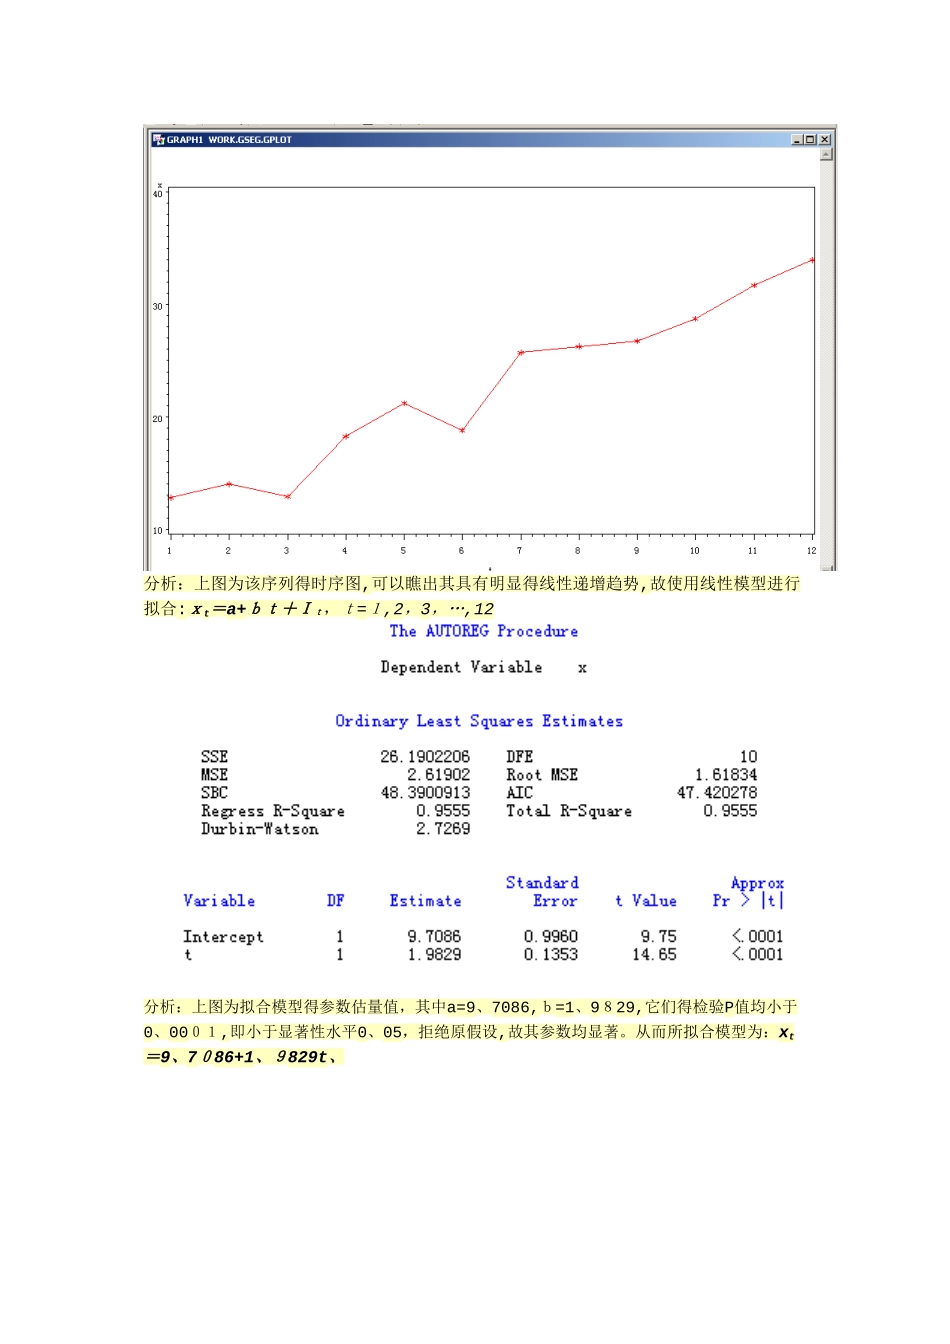
《时间序列分析》课 程 实 验 报 告项目名称:非平稳序列确定性分析组员姓名:李菲指导老师:牛宪华完成日期:201 3 年 4 月 2 0日一、上机练习(P 1 24)1、拟合线性趋势12、79 14、02 12、92 18、27 21、22 18、8125、73 26、27 26、75 28、73 31、71 33、95程序:data xiti1;input x;t=_n_;cards;12、79 14、02 12、92 18、27 21、22 18、8125、73 26、27 26、75 28、73 31、71 33、95;proc gplot data=xiti1;plot x*t;symbol c=red v=star i=join;run;proc autoreg data=xiti1;model x=t;output predicted=xhat out=out;run;proc gplot data=out;plot x*t=1 xhat*t=2/overlay;symbol2 c=green v=star i=join;run;运行结果:分析:上图为该序列得时序图,可以瞧出其具有明显得线性递增趋势,故使用线性模型进行拟合:xt=a+bt+It,t=1,2,3,…,12分析:上图为拟合模型得参数估量值,其中a=9、7086,b=1、9829,它们得检验P值均小于0、0001,即小于显著性水平0、05,拒绝原假设,故其参数均显著
从而所拟合模型为:xt=9、7086+1、9829t、分析:上图中绿色得线段为线性趋势拟合线,可以瞧出其与原数据基本吻合
2、拟合非线性趋势1、85 7、48 14、29 23、02 37、42 74、27 140、72265、81 528、23 1040、27 2064、25 4113、73 8212、21 16405、95程序:da