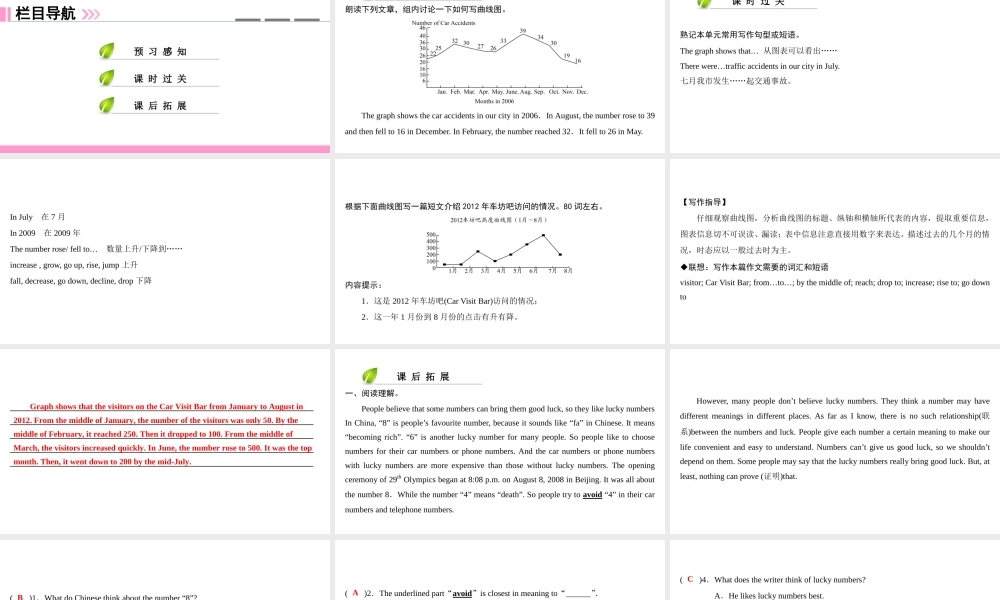
Unit 2 Numbers第 5 课时 写作栏目导航预 习 感 知课 时 过 关课 后 拓 展预 习 感 知朗读下列文章,组内讨论一下如何写曲线图
The graph shows the car accidents in our city in 2006.In August, the number rose to 39 and then fell to 16 in December
In February, the number reached 32.It fell to 26 in May
课 时 过 关熟记本单元常用写作句型或短语
The graph shows that… 从图表可以看出…… There were…traffic accidents in our city in July
七月我市发生……起交通事故
In July 在 7 月 In 2009 在 2009 年 The number rose/ fell to… 数量上升/下降到…… increase , grow, go up, rise, jump 上升 fall, decrease, go down, decline, drop 下降 根据下面曲线图写一篇短文介绍 2012 年车坊吧访问的情况
80 词左右
内容提示: 1.这是 2012 年车坊吧(Car Visit Bar)访问的情况; 2.这一年 1 月份到 8 月份的点击有升有降
【写作指导】 仔细观察曲线图,分析曲线图的标题、纵轴和横轴所代表的内容,提取重要信息,图表信息切不可误读、漏读;表中信息注意直接用数字来表达
描述过去的几个月的情况,时态应以一般过去时为主
◆联想:写作本篇作文需要的词汇和短语 visitor; Car Visit Bar; from…to…; by the middle of; reach;