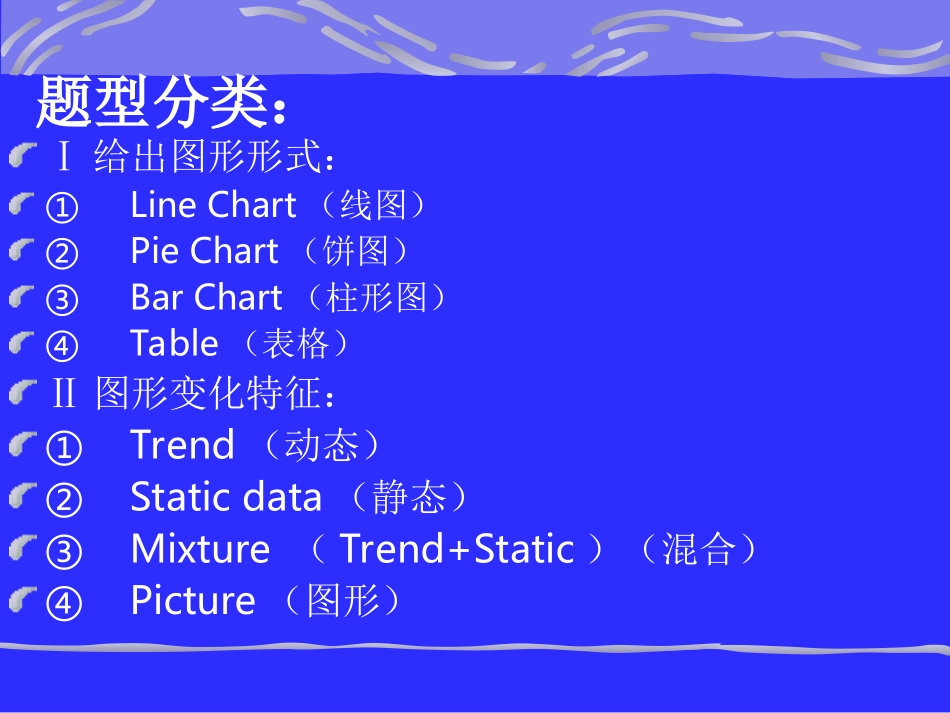
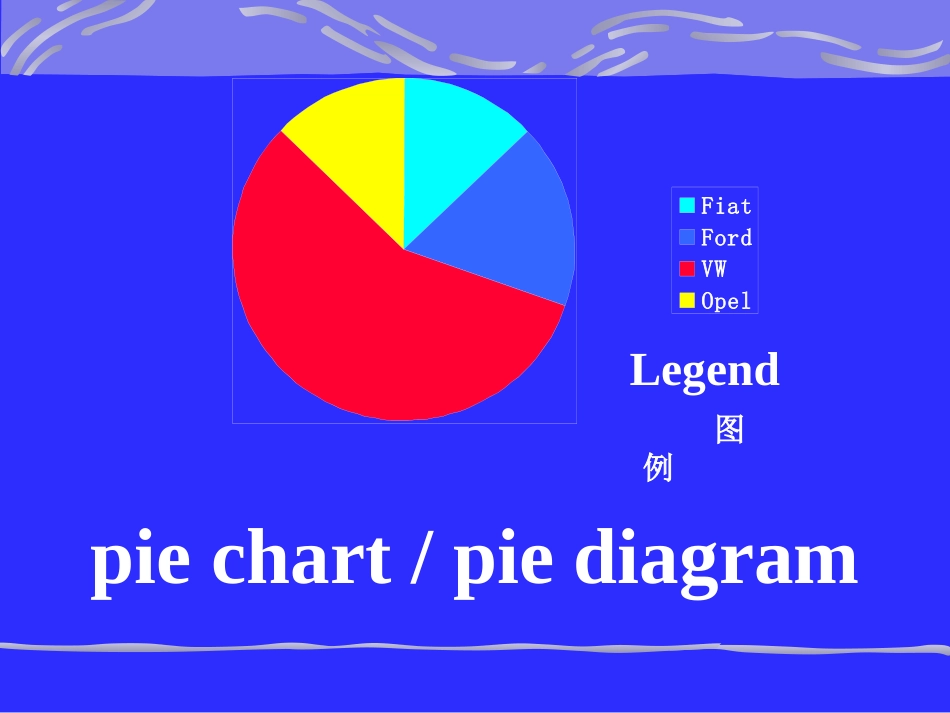
Facts&Figures陈浩扬州工业职业技术学院题型分类:Ⅰ给出图形形式:①LineChart(线图)②PieChart(饼图)③BarChart(柱形图)④Table(表格)Ⅱ图形变化特征:①Trend(动态)②Staticdata(静态)③Mixture(Trend+Static)(混合)④Picture(图形)FiatFordVWOpelLegendpiechart/piediagram图例010203040506070809020032004productiondepartmentmarketingdepartmentsalesdepartmentbarcharts/bardiagram020406080100120travelinsurrancecarinsurancehomeinsuranceLineDiagram/graph0102030405060708090applebananaorangemelonChinaIndiaThailandpantsglovesscarfvest020406080100120140160180pantsscarfglovesskirtHungryThailandJapantogoup/togethigher:increaseriseimprovegrow(上升)tobecomelower/togodown:decreasefalldrop(下降)tocontinuetobeinanunchangedstate:toreachthehighestpointthenbegintofall:remainsteadypeak(保持平稳)(达到峰值后开始回落)togetbackintoaproperstateorstationtostopclimbinghigherandcontinueatafixedheightleveloffrecover(攀升到一定高度开始走平)(恢复)decreaseincreaseleveloffremainsteadyrecoverpeakBCDEFAasharpriseslightgrowthasteadyimprovementrisesharplygrowslightlyimprovesteadily(迅猛增长)(轻微增长)(稳步增长)increasea:Adjectivesgiveinformationabout_________.b:Adverbsgiveinformationabout_________.nounsverbs1.Therewasasharpriseinsalesofcosmeticproducts.2.Aslightrecoverycouldleadtohugeprofits.3.SalesinPharmaceuticalsremainedsteadythroughtheyear.4.Salesofcosmeticproductsrosesharplylastquarter.5.CarProductionfellsteadilyinFinlandin2003.(1)Profits___________steadybetween1996and1998.remained(2)Theinsuranceclaimsshowedstrong_______throughoutthethreeyearperiod.growthAfterasharp_____in1996,orders__________for12monthsandthen_____againin1998.(3)droprecoveredfell(4)After___________steadilyfortwoyears,ordersfinally____________andbegana________in1998.decreasingleveledoffrecovery(5)Orders_____sharplyin1997but_______attheendoftheyearandthen____backtotheir1996levels.rosepeakedfell00.511.522.519941995199619971998NetincomeAfternetincomefellby£0.25min1995,therewasa(1)_______risein1996duetoincreasedsalesandreducedcosts.Thiswasfollowedbyafurtherriseinnetincomeof£0.7moverthenexttwoyears:itgrew(2)__________from£1.8min1996to£2.2min1998.sharpsteadilyNetsalesremained(3)________at£9min1994and1995thenrose(4)_________in1996toreach£21m.thiswasfollowedbyfurthergrowthassale(5)__________at£24min1997.However,asastrongpoundbegintoaffectexportstoEurope,netsalesfell(6)_________1998.05101520253019941995199619971998NetsalessteadysharplypeakedslightlySalesofcomputergamesas%1995-19980102030405060701995199619971998adventureactionsportsAssignment:(作业)CambridgeBECPreliminaryTuesday,14December2004PeakremainsteadydecreaseincreaseleveloffrecoverABCDEF柱状图BarChart•柱状图•写法:•把相同属性的柱子顶端连起来•(1)趋势特征:线状图•(2)数据对比:饼状图•ThegraphbelowshowsthedifferentmodesoftransportusedtotraveltoandfromworkinoneEuropeancityin1960,1980and2000.柱状图——线状图•四线图•分类•增长的car•减少的bus•波动的traintubeTrain,20%Car,5%Tube,30%Bus,40%TrainCarTubeBusTrain,28%Car,22%Tube,21%Bus,27%TrainCarTubeBus1960Train,21%Car,38%Tube,25%Bus,15%TrainCarTubeBus19802000P1•ThegraphbelowshowsthedifferentmodesoftransportusedtotraveltoandfromworkinoneEuropeancityin1960,1980and2000.题目•Thebargraphshowsthechangingpatternsincommutingbytrain,car,tubeorbusforcommutersinoneEuropeancityintheyears1960,1980and2000.P2•Thenumberof...