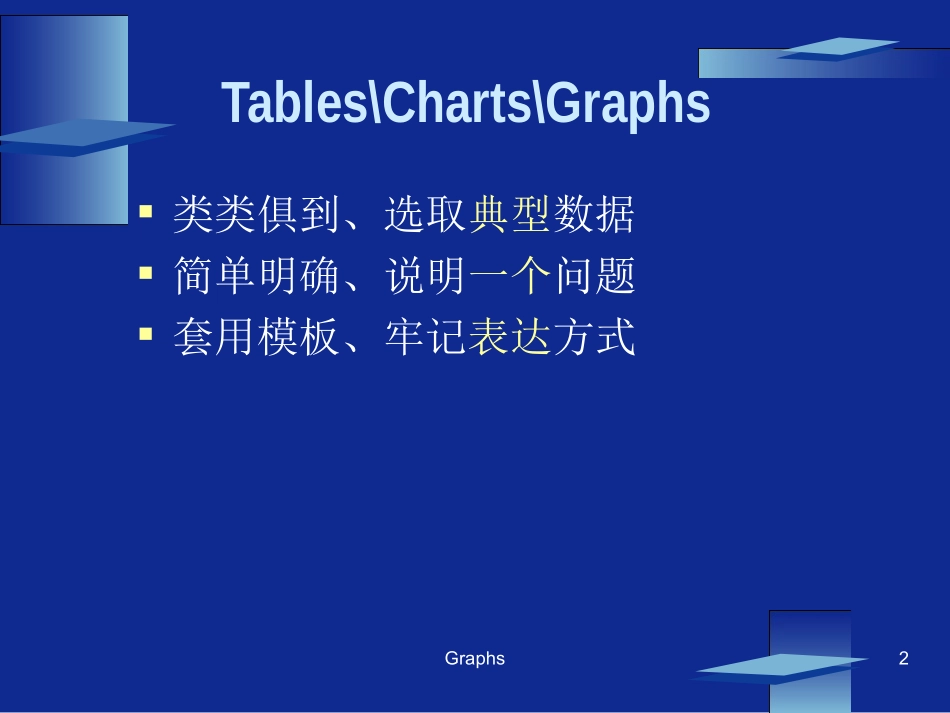
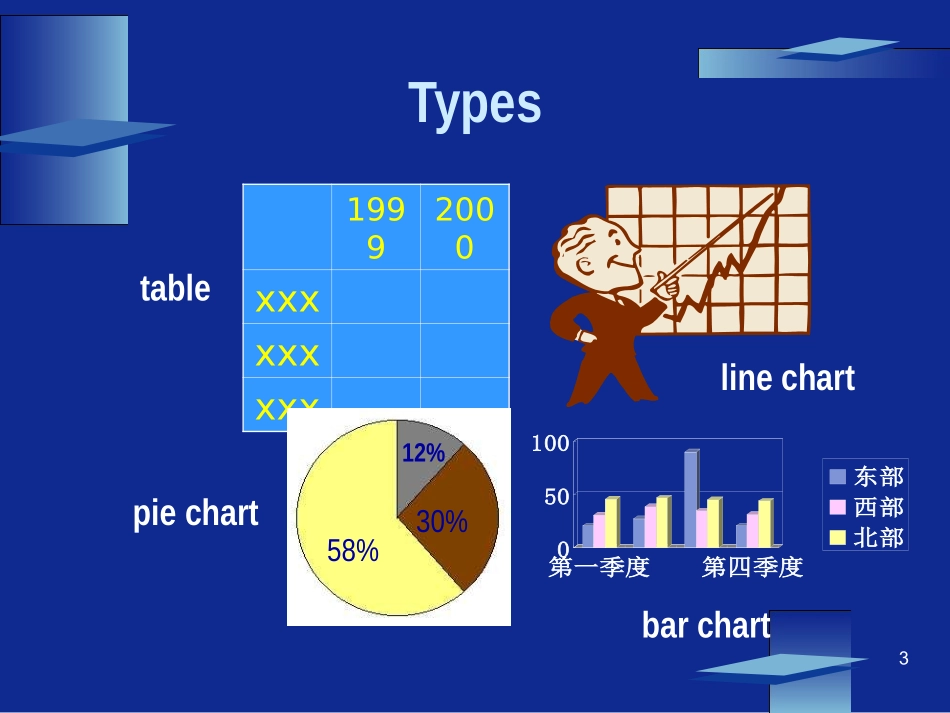
TEM4WritingTEM4Writing图表作文Graphs2Tables\Charts\Graphs类类俱到、选取典型数据简单明确、说明一个问题套用模板、牢记表达方式3Types19992000xxxxxxxxx050100第一季度第四季度东部西部北部58%30%12%tablelinechartpiechartbarchartGraphs4图表示作文1.Templates&Samples2.Expressions&ClassworkGraphs4Graphs5Sample1PeopleBelowPovertyLineOutline:1.下图所示为中国三年中贫困线以下人口的变化,请描述其变化2.请说明发生这些变化的原因3.解决目前中国贫困人口问题还有什么困难变化原因结论Barchart6Sample1YearYearNumberofPeopleNumberofPeople25015050PeopleBelowPovertyLineGraphs7Template1Thegraphdescribes(点题).Ascanbeseenfromthegraph,(概括描述).(展开一句).Severalfactorscontributetothechange.Firstofall,(第一原因).Inaddition,(第二原因).Perhapsthemaincauseis(第三原因).Fromtheanalysisabove,wecansafelyconcludethat(得出结论).(结尾句).Graphs8Sample1YearYearNumberofPeopleNumberofPeople25015050PeopleBelowPovertyLineGraphs9Sample1Recently,theissueofpeoplebelowpovertylinehasarousedmuchinterest.Ascanbeseenfromthebarchart,thenumberofpeoplebelowpovertylinedecreasedduringtheyearsof1978to1997.In1978,thereare250millionthroughoutthecountrywhilein1997only50millionpeoplewereundertheline.Graphs10Sample1Severalfactorscontributetothedecrease.Firstofall,thegovernment’spolicyofreformandopeninguphasacceleratedthecountry’sdevelopmentandprospereditseconomy.Second,people’slivingconditionhasimprovedremarkably.Allthisresultsinadropinthepoverty-strickenpopulation.Graphs11Sample1Fromtheanalysisabove,wecansafelyconcludethatthischangewillbringusmuchbenefit.However,therearestillmanypeoplelivingbelowpovertylineduetoChina’soverpopulation,limitedresourcesandrelativelylowemployment,tonamejustafew.Ofcourse,thegovernmentismakingeveryefforttosolvethoseproblems.Graphs12Sample2ChangesintheWayofTravelOutline:1.下图所示为某城市1990年至2003年间人们旅行乘车方式的变化,请描述其变化2.简述你从中得出的结论简述变化+细节描述结论tableSample2ChangesintheWayofTravelModeoftraveling19902003Byair8%25%Bytrain58%35%Bycar10%32%Bybike24%8%Total100%100%√√√√Graphs14Template2Thetabledescribes(点题).Ascanbeseenfromthegraph,(概括描述).(展开一句).Ascanbeseenfromthetable,thereareseveralremarkabletendencies:(对图表进行细节描述).Ithinktwothingscausedthechanges.(对原因的分析或自己的结论).So,wemaypredictthat(得出结论或对未来的展望).Graphs15Sample2Thetableshowsthechangesinthewaypeopletravel.Duringtheyearsbetween1990and2003,thenumberofpeopletravelingbytrain,byairandbyprivatecarhaschangedagreatdeal.16Sample2Ascanbeseenfromthetable,therearetworemarkabletendencies:oneistherateoftravelingbyair,andtheotheristhatbyprivatecars.Theformerrosefrom8%in1990to25%in2003,whilethelatterfrom10%to32%,bothincreasingmorethan3times.Thetablealsoshowsthatthenumberofpeopletravelingbytraindecreasedby23%thoughitisstillmanypeople’sfirstchoice.Graphs17Sample2Ithinktwothingscausedthechanges.First,peoplearebetteroff.Theycanaffordtotravelbyairorintheirowncars.Second,travelingbytrainisstillfavoredbythemajority,sinceitischeaper.So,wemaypredictthataspeople’slivingstandardisimproving,trains,carsandplaneswillbethreemainformsoftransportationforlong-distancetravel.Graphs18increasedecrease(1)(2)(3)(4)risedramaticallyincreasesteadilydropsharplyfallgraduallyExpressionsGraphs19Expressionsincreaserisejumpdramaticallyrapidlysignificantlysuddenlysharplyslightlygraduallysteadilydecrea...