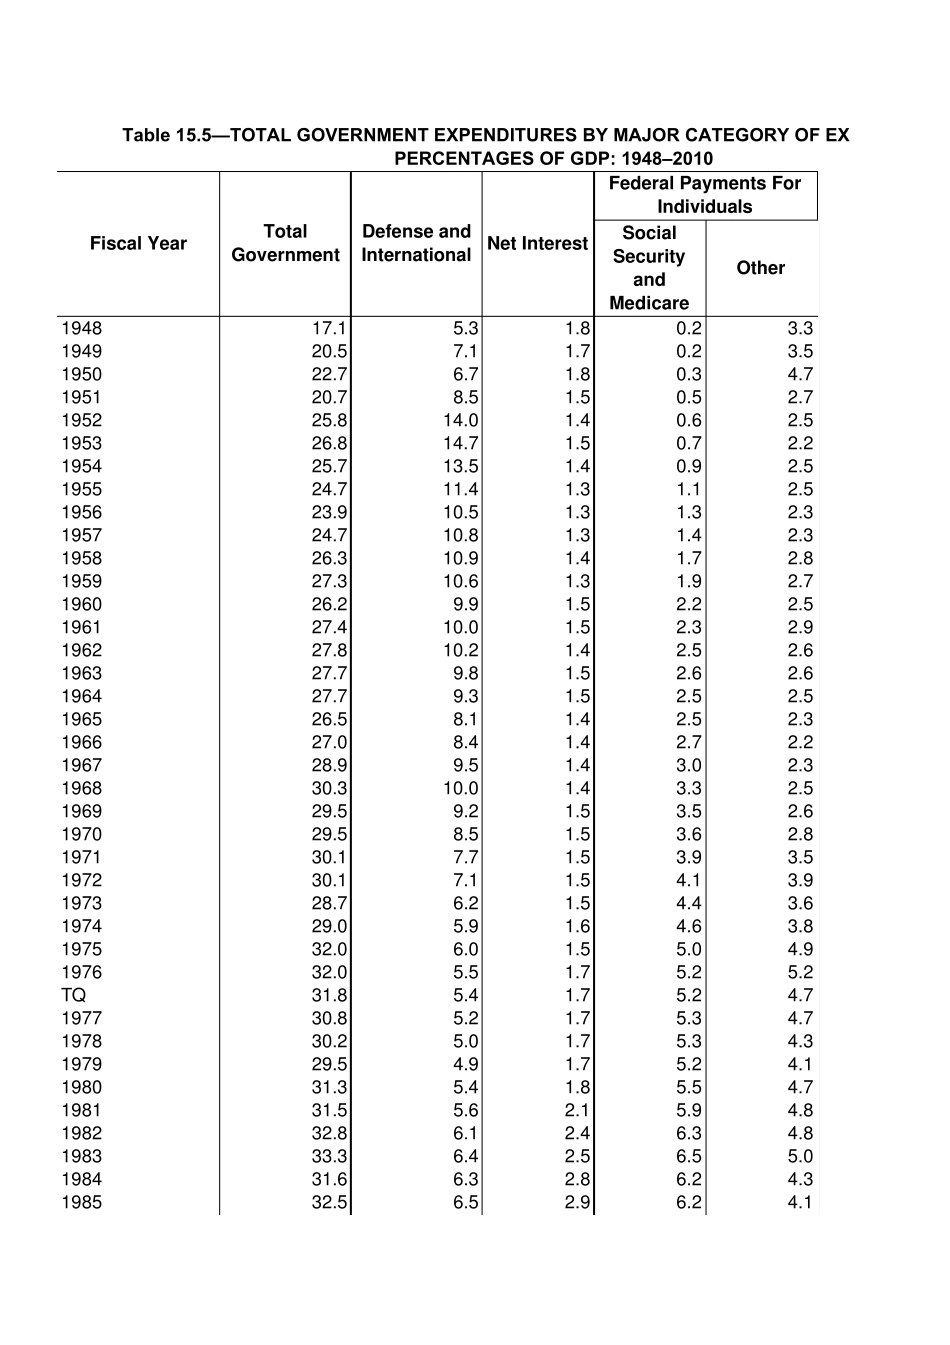
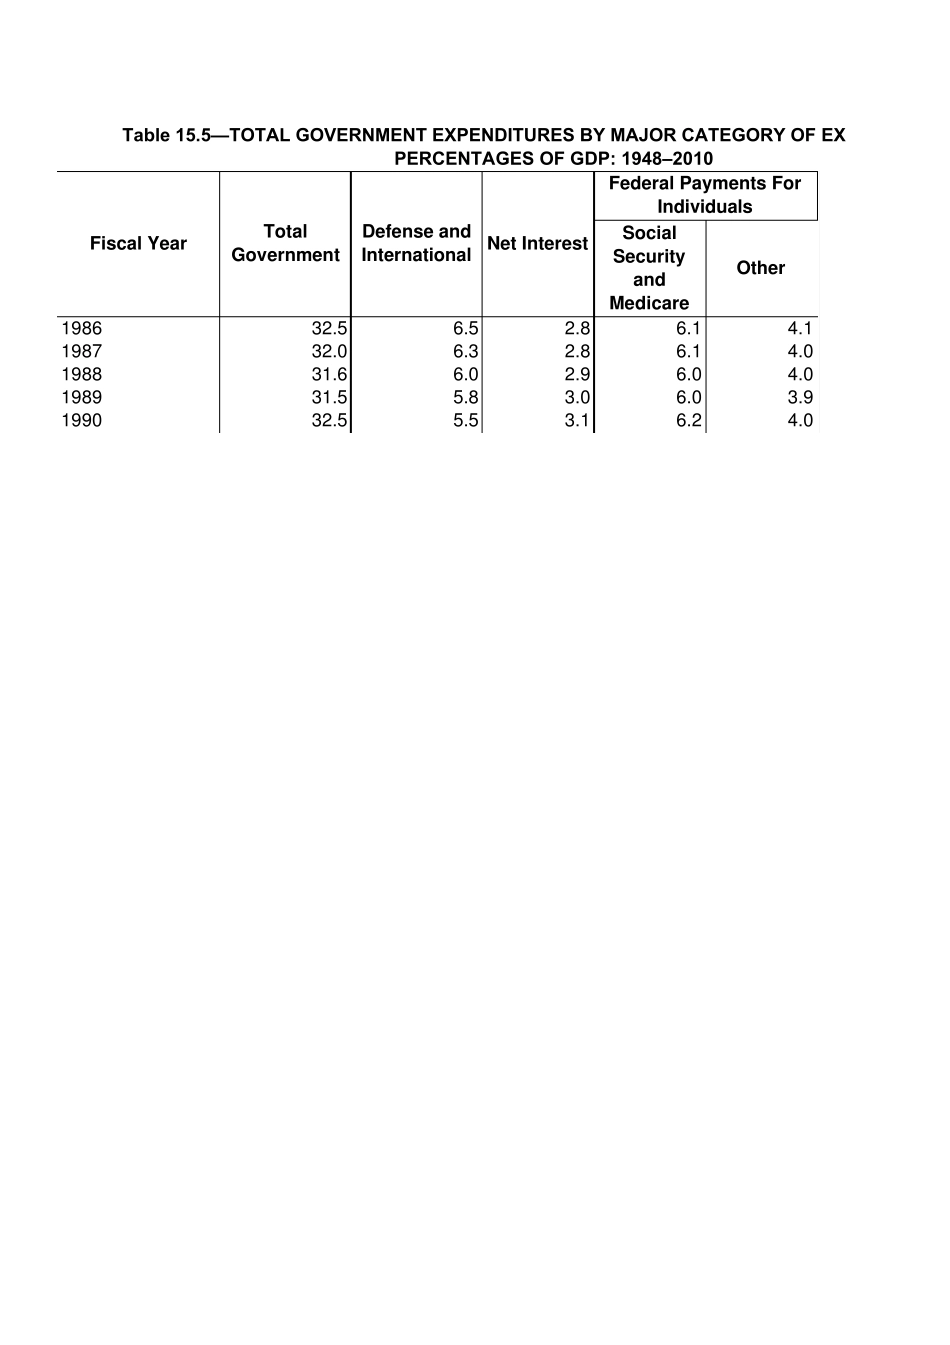
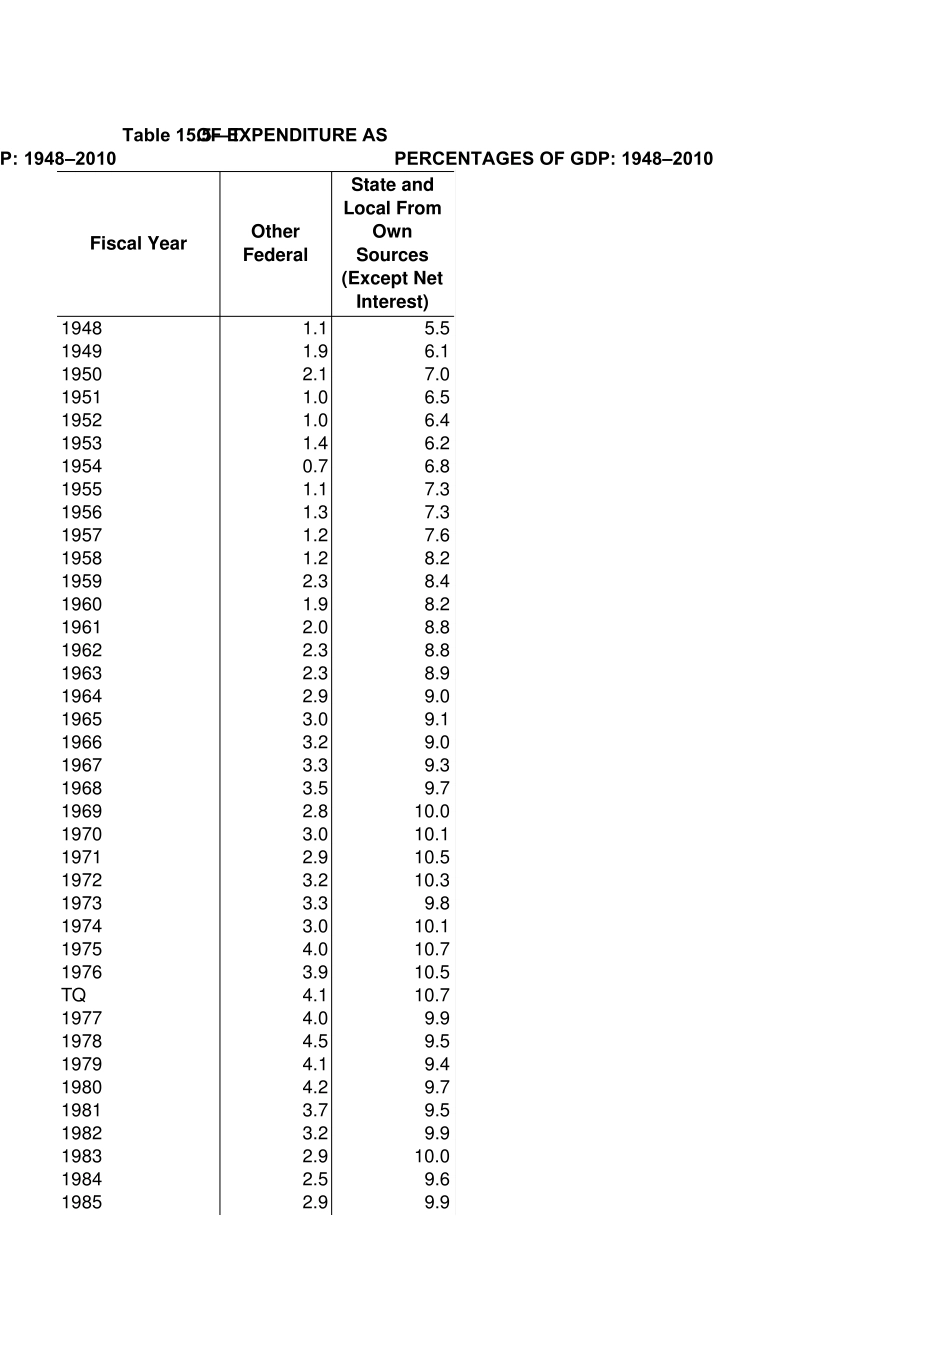
SocialSecurityandMedicareOther194817.15.31.80.23.3194920.57.11.70.23.5195022.76.71.80.34.7195120.78.51.50.52.7195225.814.01.40.62.5195326.814.71.50.72.2195425.713.51.40.92.5195524.711.41.31.12.5195623.910.51.31.32.3195724.710.81.31.42.3195826.310.91.41.72.8195927.310.61.31.92.7196026.29.91.52.22.5196127.410.01.52.32.9196227.810.21.42.52.6196327.79.81.52.62.6196427.79.31.52.52.5196526.58.11.42.52.3196627.08.41.42.72.2196728.99.51.43.02.3196830.310.01.43.32.5196929.59.21.53.52.6197029.58.51.53.62.8197130.17.71.53.93.5197230.17.11.54.13.9197328.76.21.54.43.6197429.05.91.64.63.8197532.06.01.55.04.9197632.05.51.75.25.2TQ31.85.41.75.24.7197730.85.21.75.34.7197830.25.01.75.34.3197929.54.91.75.24.1198031.35.41.85.54.7198131.55.62.15.94.8198232.86.12.46.34.8198333.36.42.56.55.0198431.66.32.86.24.3198532.56.52.96.24.1Table 15.5—TOTAL GOVERNMENT EXPENDITURES BY MAJOR CATEGORY OF EXPERCENTAGES OF GDP: 1948–2010Fiscal YearTotalGovernmentDefense andInternationalNet InterestFederal Payments ForIndividualsSocialSecurityandMedicareOtherTable 15.5—TOTAL GOVERNMENT EXPENDITURES BY MAJOR CATEGORY OF EXPERCENTAGES OF GDP: 1948–2010Fiscal YearTotalGovernmentDefense andInternationalNet InterestFederal Payments ForIndividuals1 9 8 63 2 .56 .52 .86 .14 .11 9 8 73 2 .06 .32 .86 .14 .01 9 8 83 1 .66 .02 .96 .04 .01 9 8 93 1 .55 .83 .06 .03 .91 9 9 03 2 .55 .53 .16 .24 .019481949195019511952195319541955195619571958195919601961196219631964196519661967196819691970197119721973197419751976TQ197719781979198019811982198319841985Table 15.5—TPERCENTAGES OF GDP: 1948–2010Fiscal Year1.15.51.96.12.17.01.06.51.06.41.46.20.76.81.17.31.37.31.27.61.28.22.38.41.98.22.08.82.38.82.38.92.99.03.09.13.29.03.39.33.59.72.810.03.010.12.910.53.210.33.39.83.010.14.010.73.910.54.110.74.09.94.59.54.19.44.29.73.79.53.29.92.910.02.59.62.99.9OF EXPENDITURE ASP: 1948–2010OtherFederalState andLocal FromOwnSources(Except NetIntere...