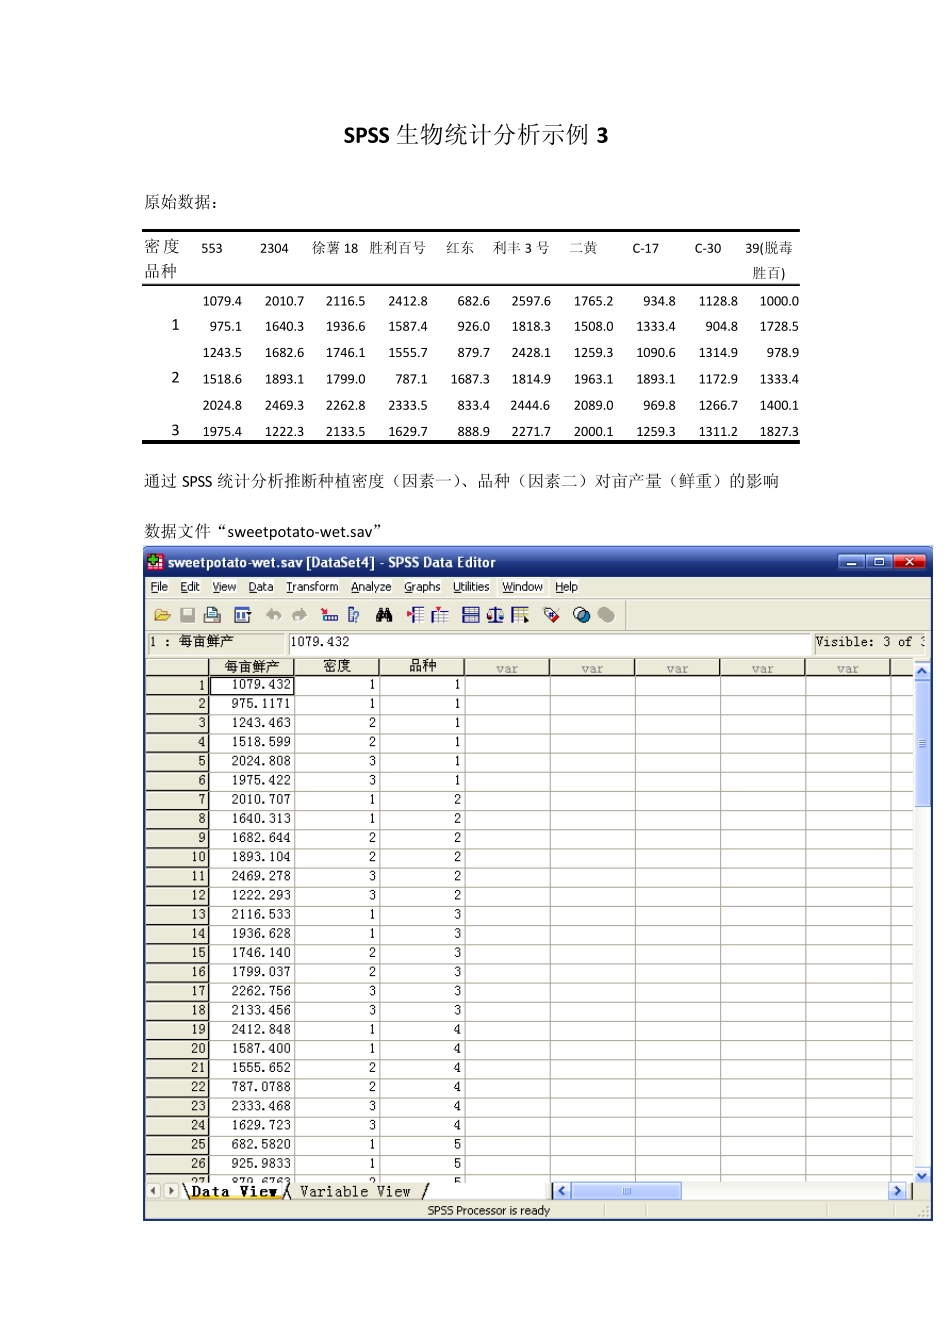
SPSS 生物统计分析示例3 原始数据: 通过SPSS 统计分析推断种植密度(因素一)、品种(因素二)对亩产量(鲜重)的影响 数据文件“sw eetpotato-w et
sav” 密度 品种 553 2304 徐薯 18 胜利百号 红东 利丰 3 号 二黄 C-17 C-30 39(脱毒胜百) 1 1079
4 2010
7 2116
5 2412
6 2597
6 1765
8 1128
8 1000
1 1640
3 1936
6 1587
0 1818
3 1508
0 1333
8 1728
5 2 1243
5 1682
6 1746
1 1555
7 2428
1 1259
3 1090
6 1314
9 1518
6 1893
1 1799
1 1687
3 1814
9 1963
1 1893
1 1172
9 1333
4 3 2024
8 2469
3 2262
8 2333
4 2444
6 2089
8 1266
7 1400
1 1975
4 1222
3 2133
5 1629
9 2271
7 2000
1 1259
3 1311
2 1827
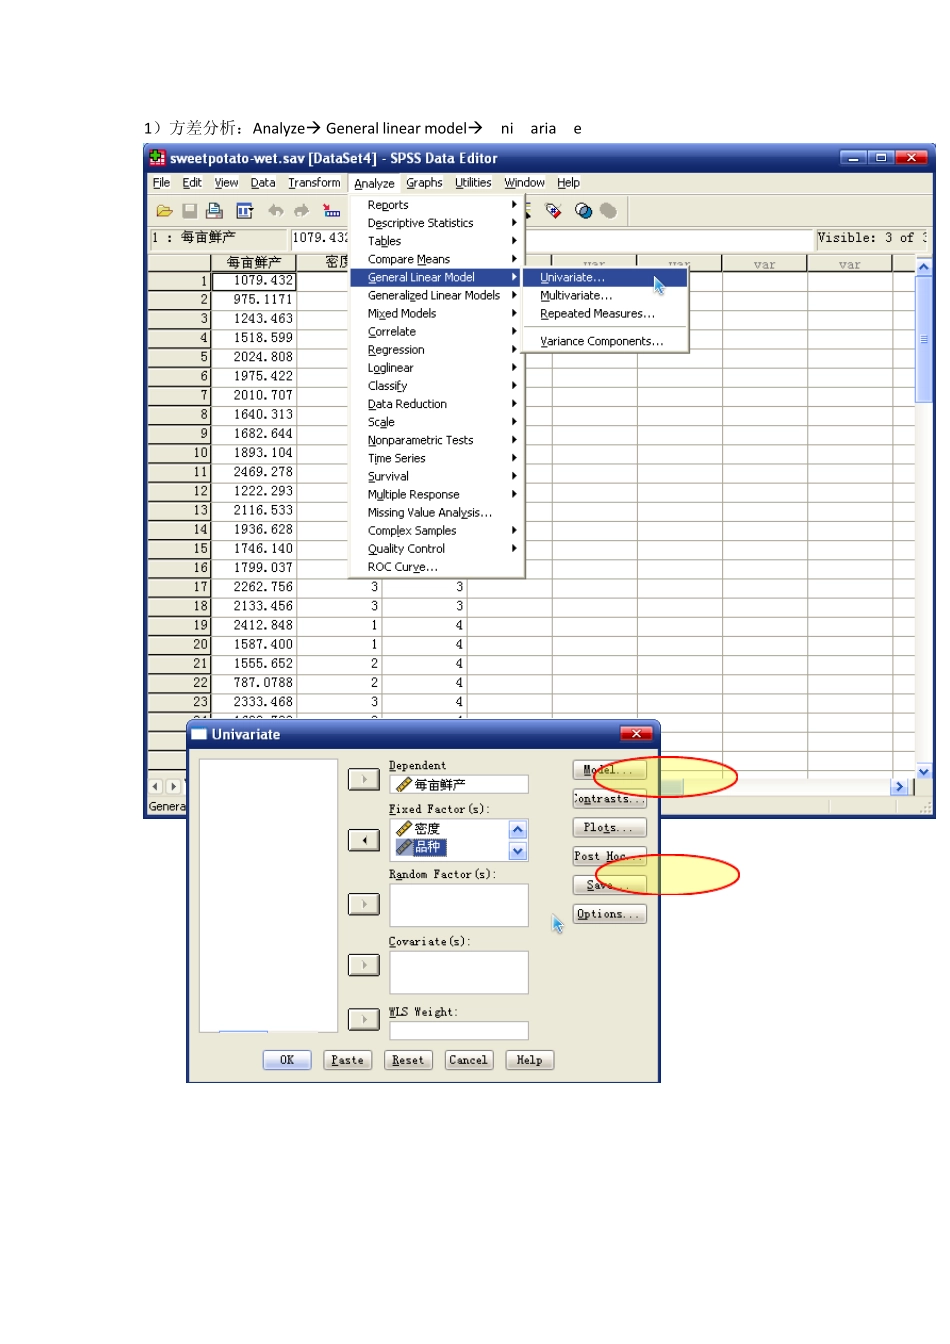
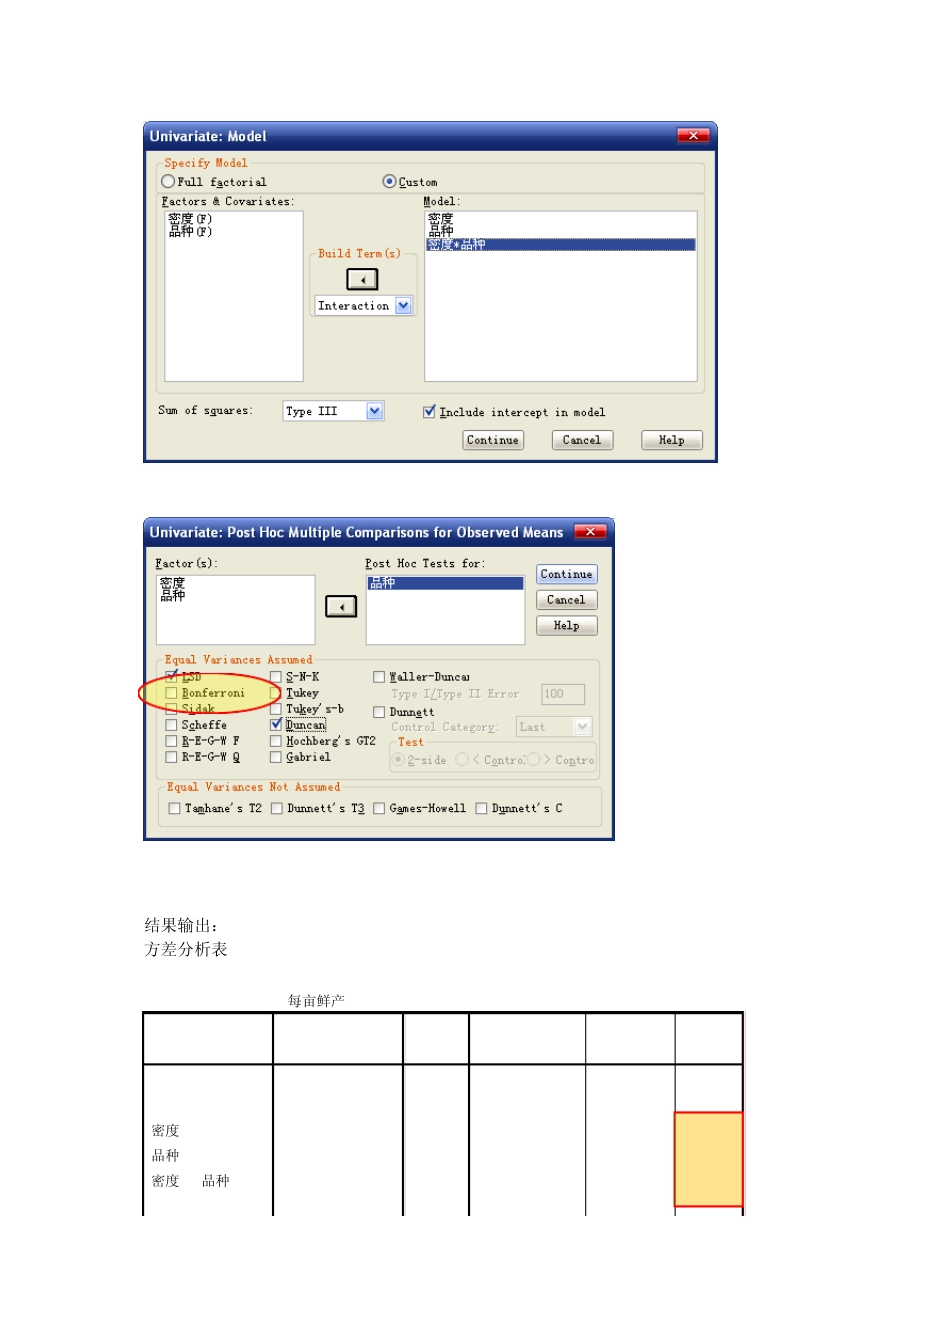
3 1)方差分析:Analyze General linear modelUnivariate… 结果输出: 方差分析表 Tests of Between-Subjects Effects Dependent Variable: 每亩鲜产 Source Type III Sum of Squares df Mean Square F Sig
Corrected Model 11407755
723(a) 29 393370
002 Interc