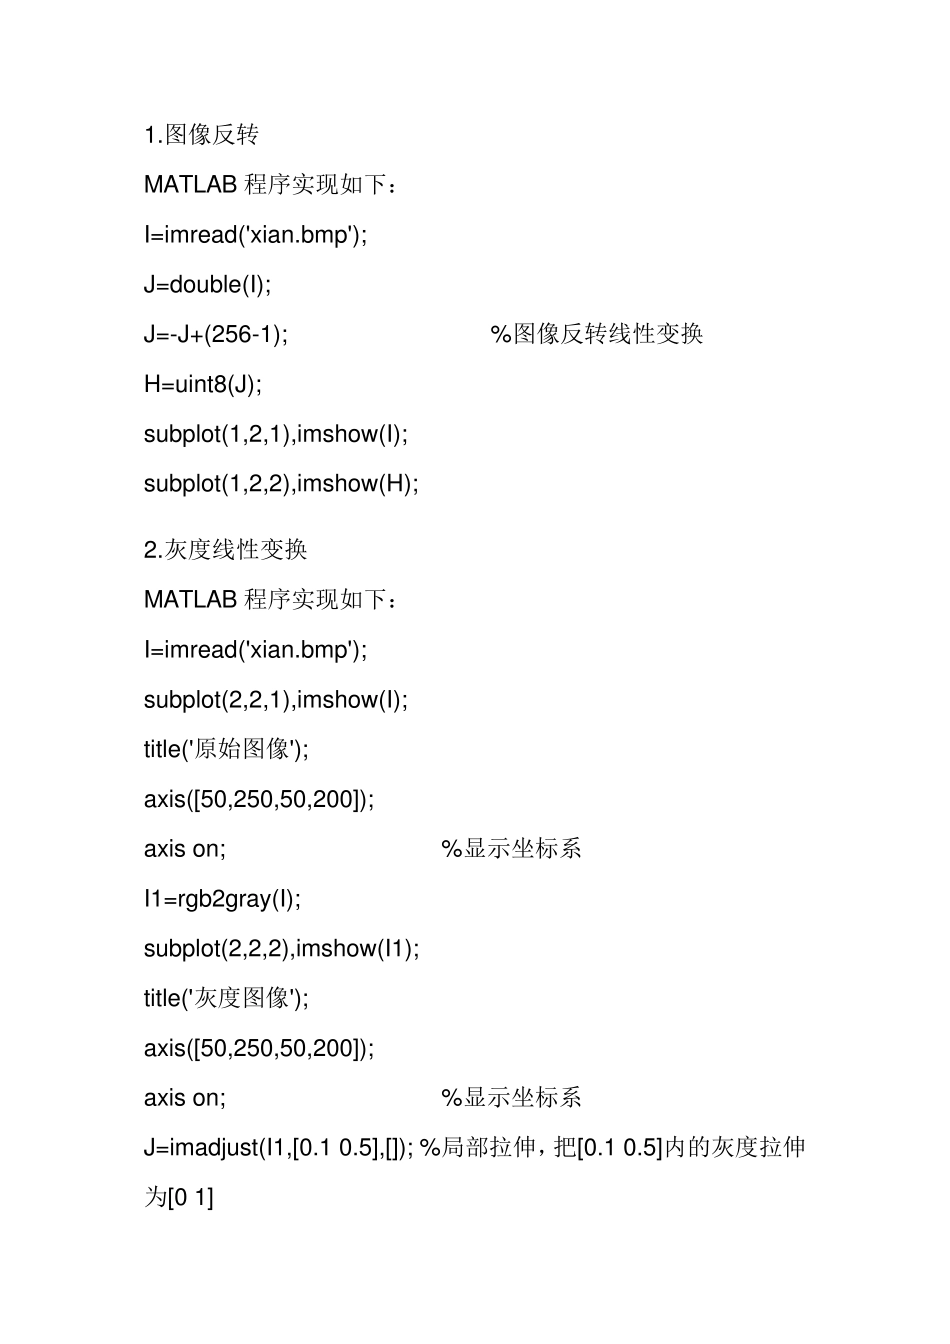
1.图像反转 MATLAB 程序实现如下: I=imread('xian.bmp'); J=double(I); J=-J+(256-1); %图像反转线性变换 H=uint8(J); subplot(1,2,1),imshow(I); subplot(1,2,2),imshow(H); 2.灰度线性变换 MATLAB 程序实现如下: I=imread('xian.bmp'); subplot(2,2,1),imshow(I); title('原始图像'); axis([50,250,50,200]); axis on; %显示坐标系 I1=rgb2gray(I); subplot(2,2,2),imshow(I1); title('灰度图像'); axis([50,250,50,200]); axis on; %显示坐标系 J=imadjust(I1,[0.1 0.5],[]); %局部拉伸,把[0.1 0.
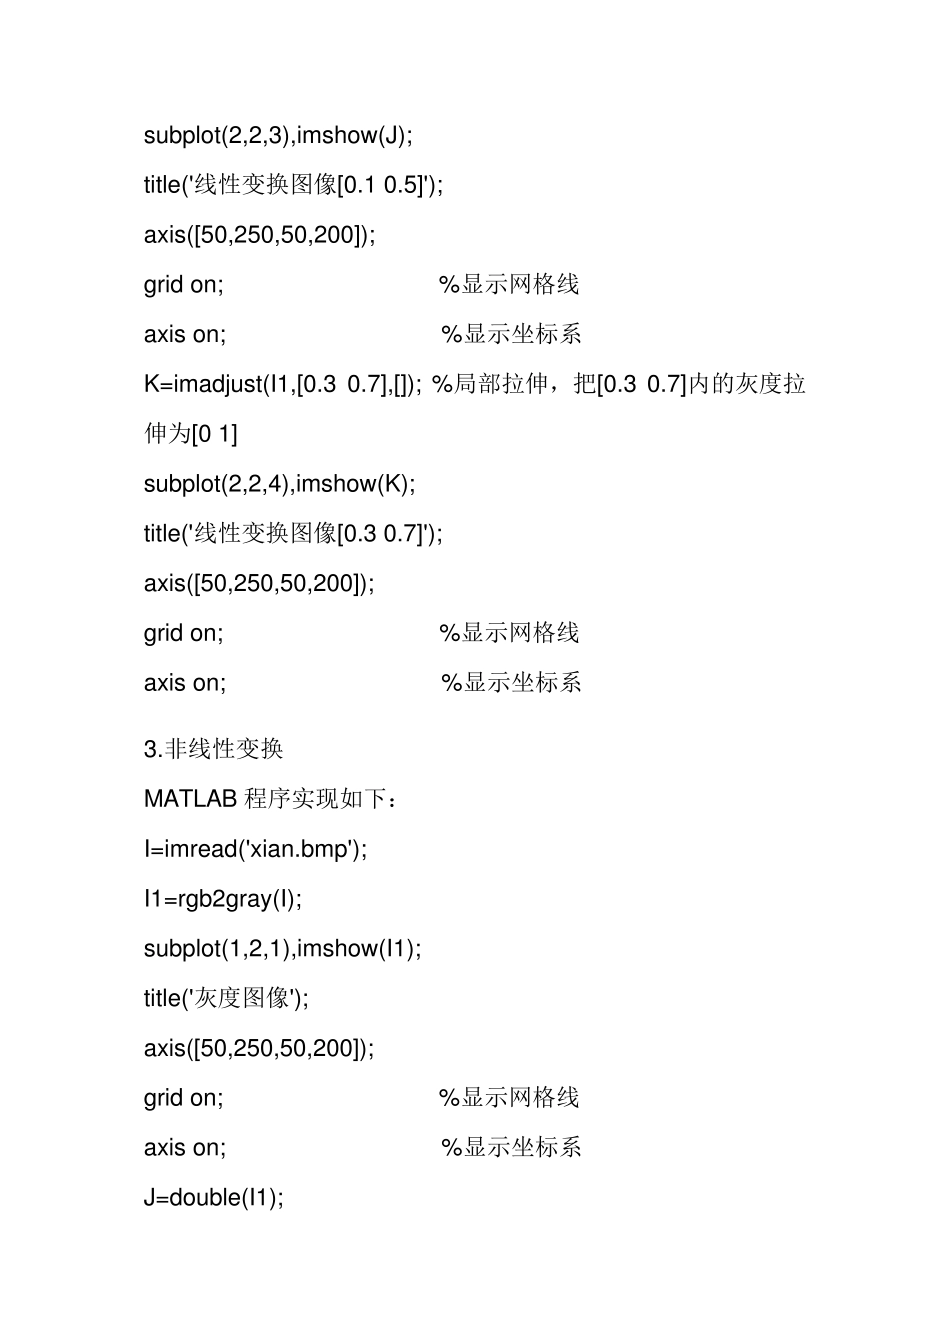
5]内的灰度拉伸为[0 1] subplot(2,2,3),imshow(J); title('线性变换图像[0.1 0.5]'); axis([50,250,50,200]); grid on; %显示网格线 axis on; %显示坐标系 K=imadjust(I1,[0.3 0.7],[]); %局部拉伸,把[0.3 0.7]内的灰度拉伸为[0 1] subplot(2,2,4),imshow(K); title('线性变换图像[0.3 0.7]'); axis([50,250,50,200]); grid on; %显示网格线 axis on; %显示坐标系 3.
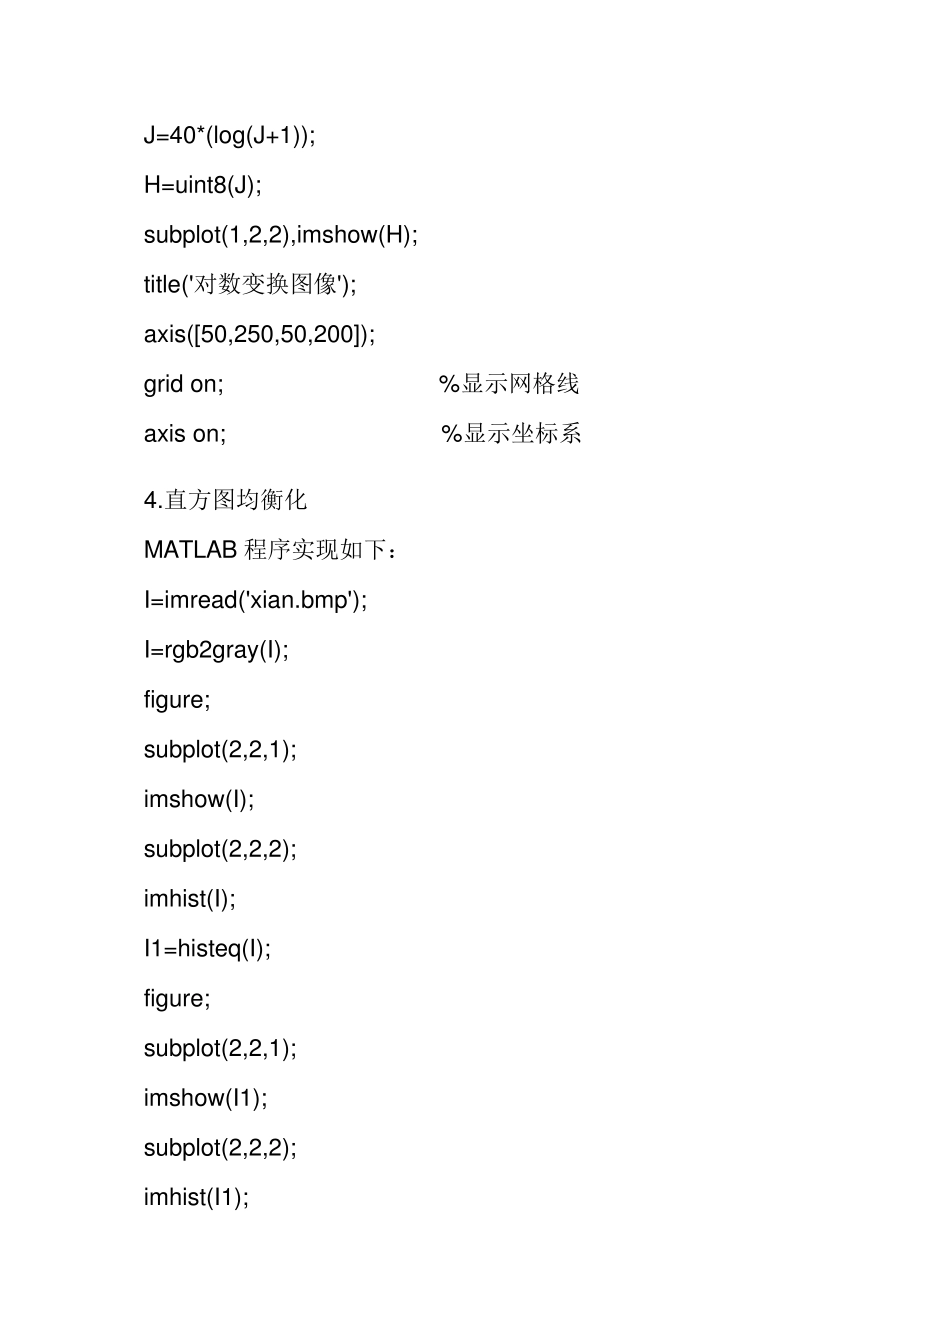
非线性变换 MATLAB 程序实现如下: I=imread('xian.bmp'); I1=rgb2gray(I); subplot(1,2,1),imshow(I1); title('灰度图像'); axis([50,250,50,200]); grid on; %显示网格线 axis on; %显示坐标系 J=double(I1); J=40*(log(J+1)); H=uint8(J); subplot(1,2,2),imshow(H); title('对数变换图像'); axis([50,250,50,200]); grid on; %显示网格线 axis on; %显示坐标系 4.直方图均衡化 MATLAB 程序实现如下: I=imread('xian.bmp'); I=rgb2gray(I); figure; subplot(2,2,1); imshow(I); subplot(2,2,2); imhist(I); I1=histeq(I); figure; subplot(2,2,1); imshow(I1); subplot(2,2,2); imhist(I1); 5.线性平滑滤波器 用MATLAB 实现领域平均法抑制噪声程序: I=imread('xian.bmp'); subplot(231) imshow(I) title('原始图像') I=rgb2gray(I); I1=imnoise(I,'salt & pepper',0.02); subplot(232) imshow(I1) title('添加椒盐噪声的图像') k1=filter2(fspecial('average',3),I1)/255; %进行3*3模板平滑滤波 k2=filter2(fspecial('average',5),I1)/255; %进行5*5模板平滑滤波k3=filter2(fspecial('average',7),I1)/255; %进行7*7模板平滑滤波 k4=filter2(fspecial('average',9),I1)/255; %进行9*9模板平滑滤波 subplot(233),imshow(k1);title('3*3模板平滑滤...