Is What You See, What You Get? Geospatial Visualizations Address Scale and Usability AashishChaudhary and Jeff Baumes Unlimited geospatial information now is at everyone’s fingertips with the proliferation of GPS-embedded mobile devices and large online geospatial databases. To fully understand these data and make wise decisions, more people are turning to informatics and geospatial visualization, which are used to solve many real-world problems. To effectively gather information from data, it’s critical to address scalability and intuitive user interactions and visualizations. New geospatial analysis and visualization techniques are being used in fields such as video analysis for national defense, urban planning and hydrology. 
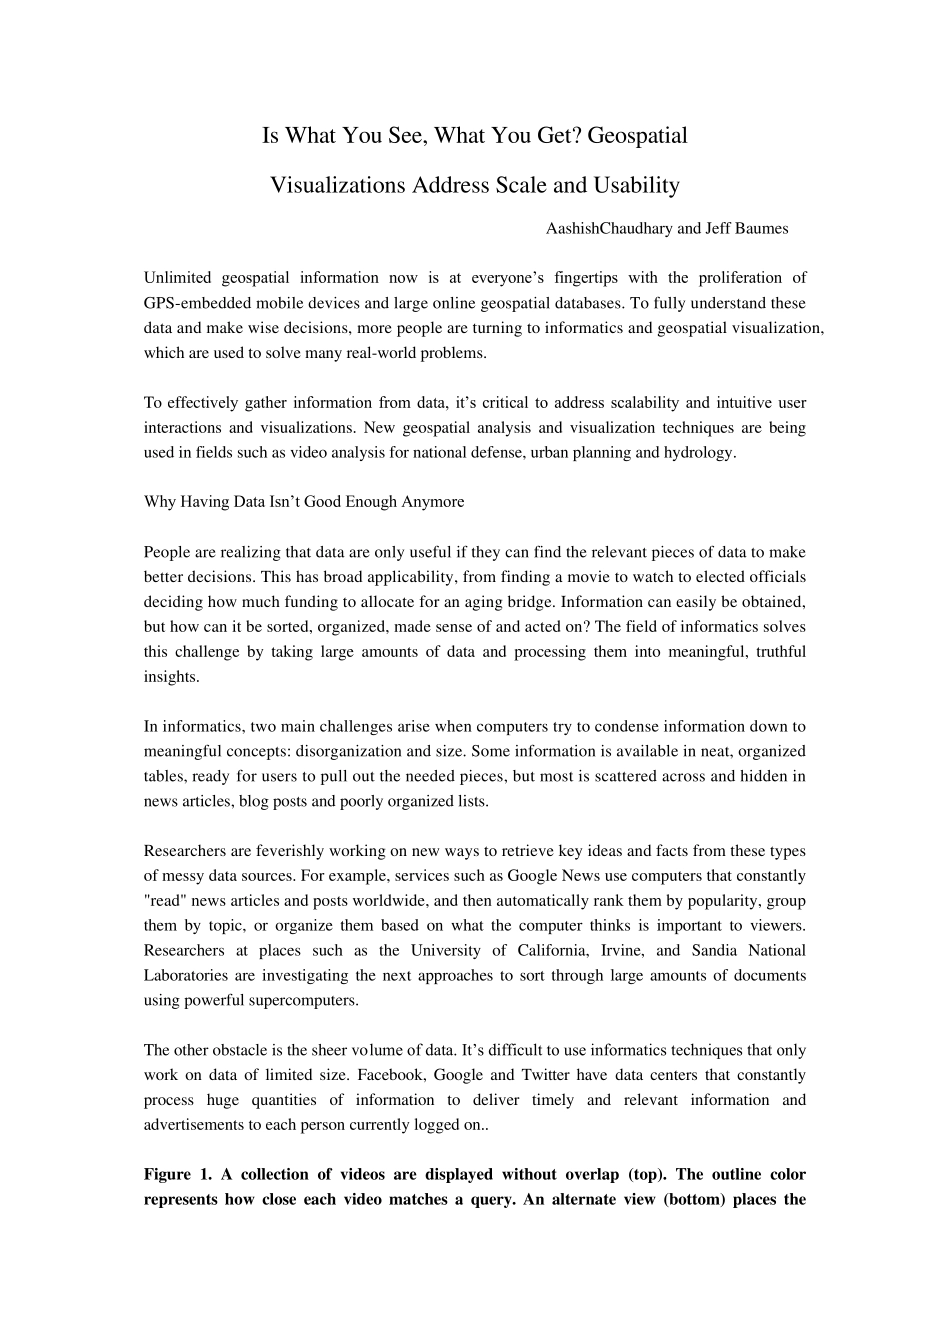
Why Having Data Isn’t Good Enough Anymore People are realizing that data are only useful if they can find the relevant pieces of data to make better decisions. This has broad applicability, from finding a movie to watch to elected officials deciding how much funding to allocate for an aging bridge. Information can easily be obtained, but how can it be sorted, organized, made sense of and acted on? The field of informatics solves this challenge by taking large amounts of data and processing them into meaningful, truthful insights. In informatics, two main challenges arise when computers try to condense information down to meaningful concepts: disorganization and size. Some information is available in neat, organized tables, ready for users to pull out the needed pieces, but most is scattered across and hidden in news articles, blog posts and poorly organized lists. Researchers are feverishly working on new ways to retrieve key ideas and facts from these types of messy data sources...