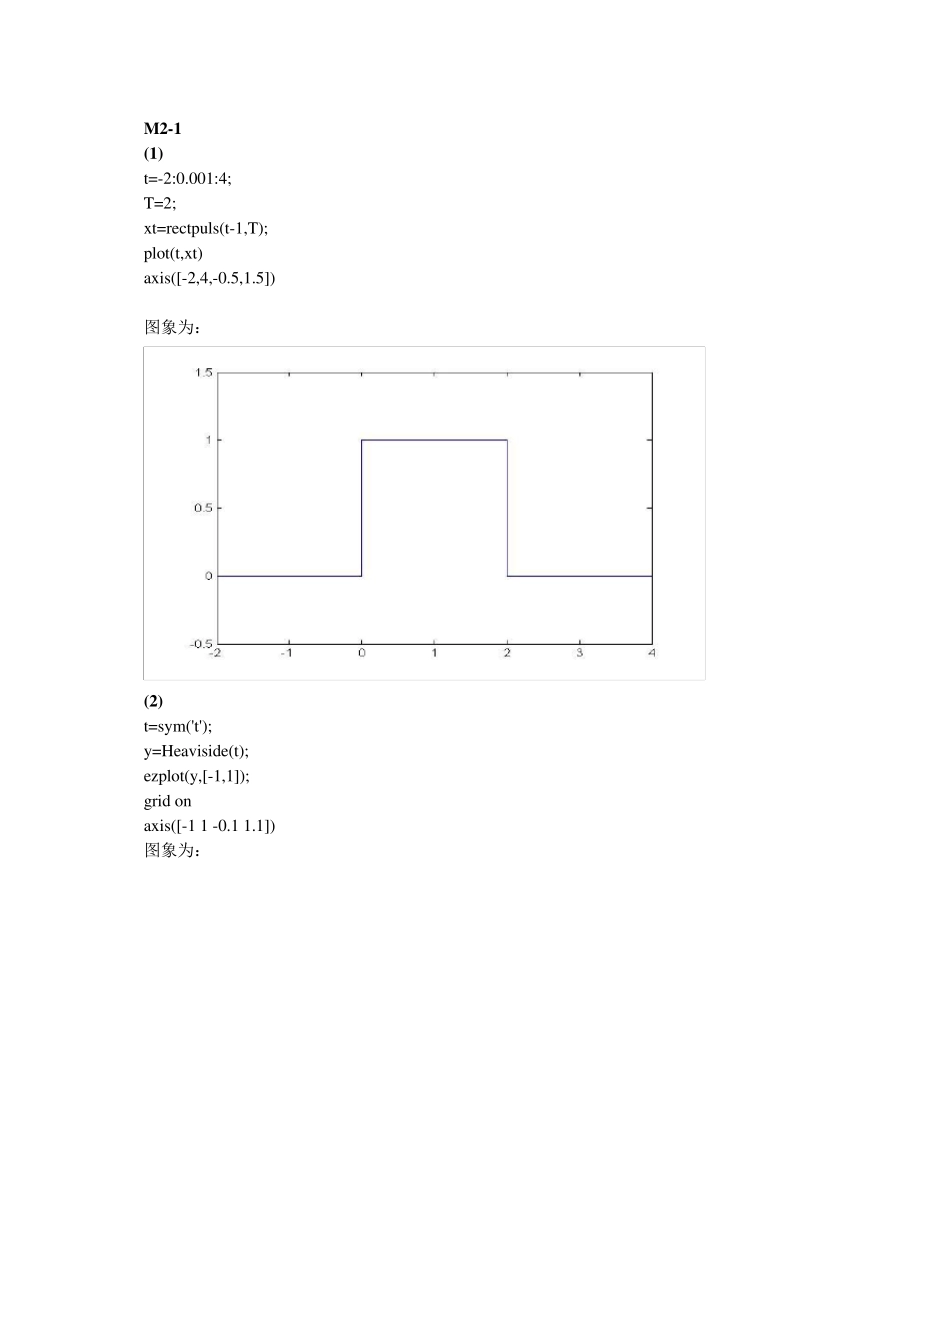
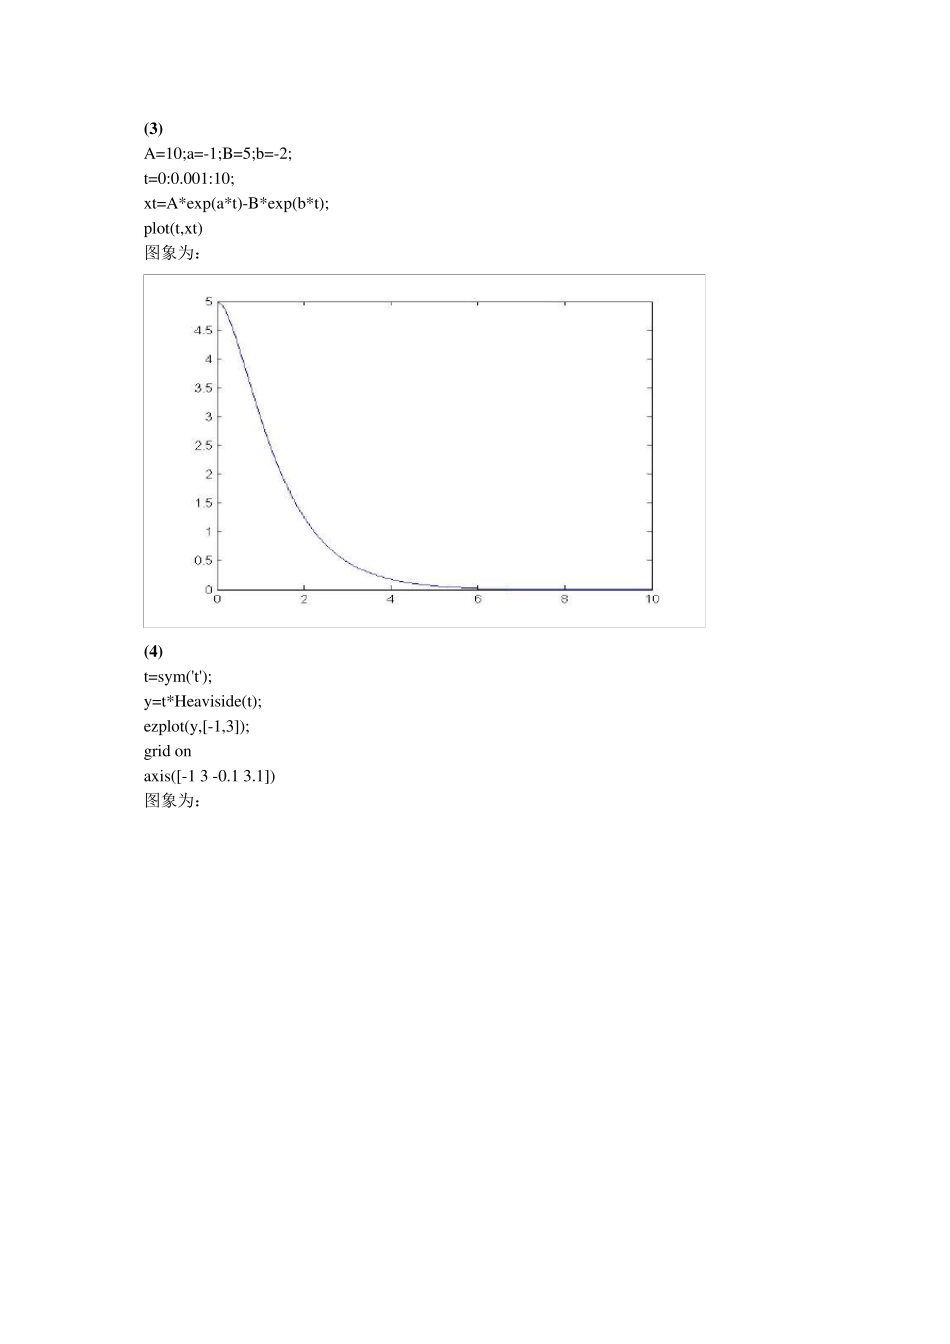
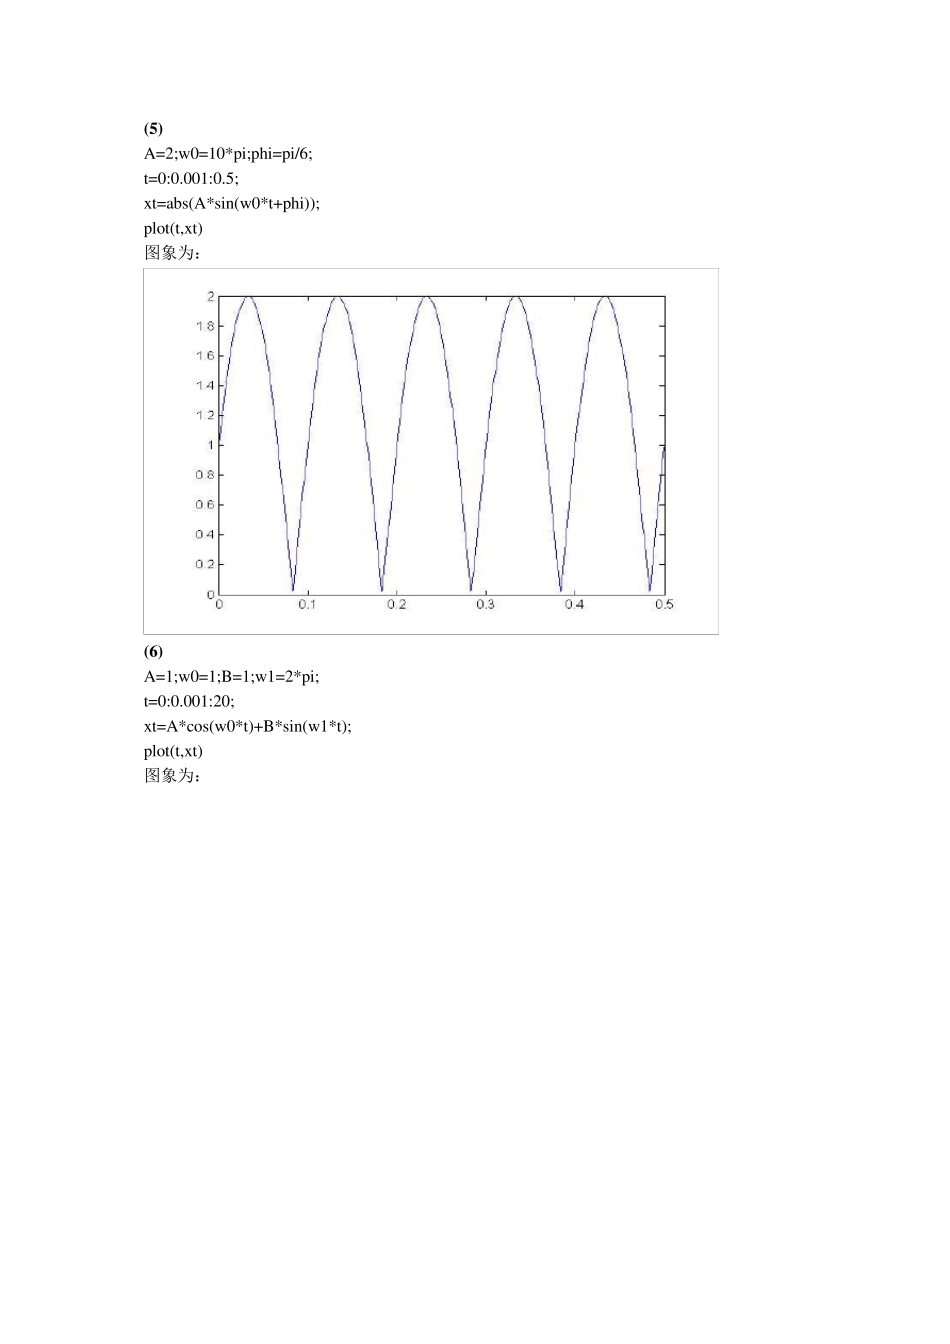
M 2-1 (1) t=-2:0.001:4; T=2; xt=rectpuls(t-1,T); plot(t,xt) axis([-2,4,-0.5,1.5]) 图象为: (2) t=sym('t'); y=Heaviside(t); ezplot(y,[-1,1]); grid on axis([-1 1 -0.1 1.1]) 图象为: (3 ) A=10;a=-1;B=5;b=-2; t=0:0.001:10; xt=A*exp(a*t)-B*exp(b*t); plot(t,xt) 图象为: (4 ) t=sym('t'); y=t*Heaviside(t); ezplot(y,[-1,3]); grid on axis([-1 3 -0.1 3.1]) 图象为: (5 ) A=2;w0=10*pi;phi=pi/6; t=0:0.001:0.5; xt=abs(A*sin(w0*t+phi)); plot(t,xt) 图象为: (6 ) A=1;w0=1;B=1;w1=2*pi; t=0:0.001:20; xt=A*cos(w0*t)+B*sin(w1*t); plot(t,xt) 图象为: (7 ) A=4;a=-0.5;w0=2*pi; t=0:0.001:10; xt=A*exp(a*t).*cos(w0*t); plot(t,xt) 图象为: (8 ) w0=30; t=-15:0.001:15; xt=cos(w0*t).*sinc(t/pi); plot(t,xt) axis([-15,15,-1.1,1.1]) 图象为: M 2-3 (1)fu nction y t=x 2_3(t) y t=(t).*(t>=0&t<=2)+2*(t>=2&t<=3)-1*(t>=3&t<=5); (2) fu nction y t=x 2_3(t) y t=(t).*(t>=0&t<=2)+2*(t>=2&t<=3)-1*(t>=3&t<=5); t=0:0.001:6; su bplot(3,1,1) plot(t,x 2_3(t)) title('x (t)') ax is([0,6,-2,3]) su bplot(3,1,2) plot(t,x 2_3(0.5*t)) title('x (0.5t)') ax is([0,11,-2,3]) su bplot(3,1,3) plot(t,x 2_3(2-0.5*t)) title('x (2-0.5t)') ax is([-6,5,-2,3]) 图像为: M 2-9 (1) k=-4:7; x k=[-3,-2,3,1,-2,-3,-4,2,-1,4,1,-1]; stem(k,x k,'file') (2) k=-12:21; x =[-3,0,0,-2,0,0,3,0,0,1,0,0,-2,0,0,-3,0,0,-4,0,0,2,0,0,-1,0,0,4,0,0,1,0,0,-1]; su bplot(2,1,1) stem(k,x ,'file') title('3 倍内插') t=-1:2; y =[-2,-2,2,1]; su bplot(2,1,2) stem(t,y ,'file') title('3 倍抽取') ax is([-3,4,-4,4]) (3 ) k=-4:7; x =[-3,-2,3,1,-2,-3,-4,2,-1,4,1,-1]; su bplot(2,1,1) stem(k+2,x ,'file') title('x [k+2]') su bplot(2,1,2) stem(k-4,x ,'file') title('x [k-4]') (4 ) k=-4:7; x =[-3,-2,3,1,-2,-3,-4,2,-1,4,1,-1]; stem(-fliplr(k),fliplr(x ),'file') title('x [-k]') M 3-1 (1) ts=0;te=5;dt=0.01; sy s=tf([2 1],[1 3 2]); t=ts:dt:te; x =ex p(-3*t); y =lsim(sy s,x ,t); plot(t,y ...