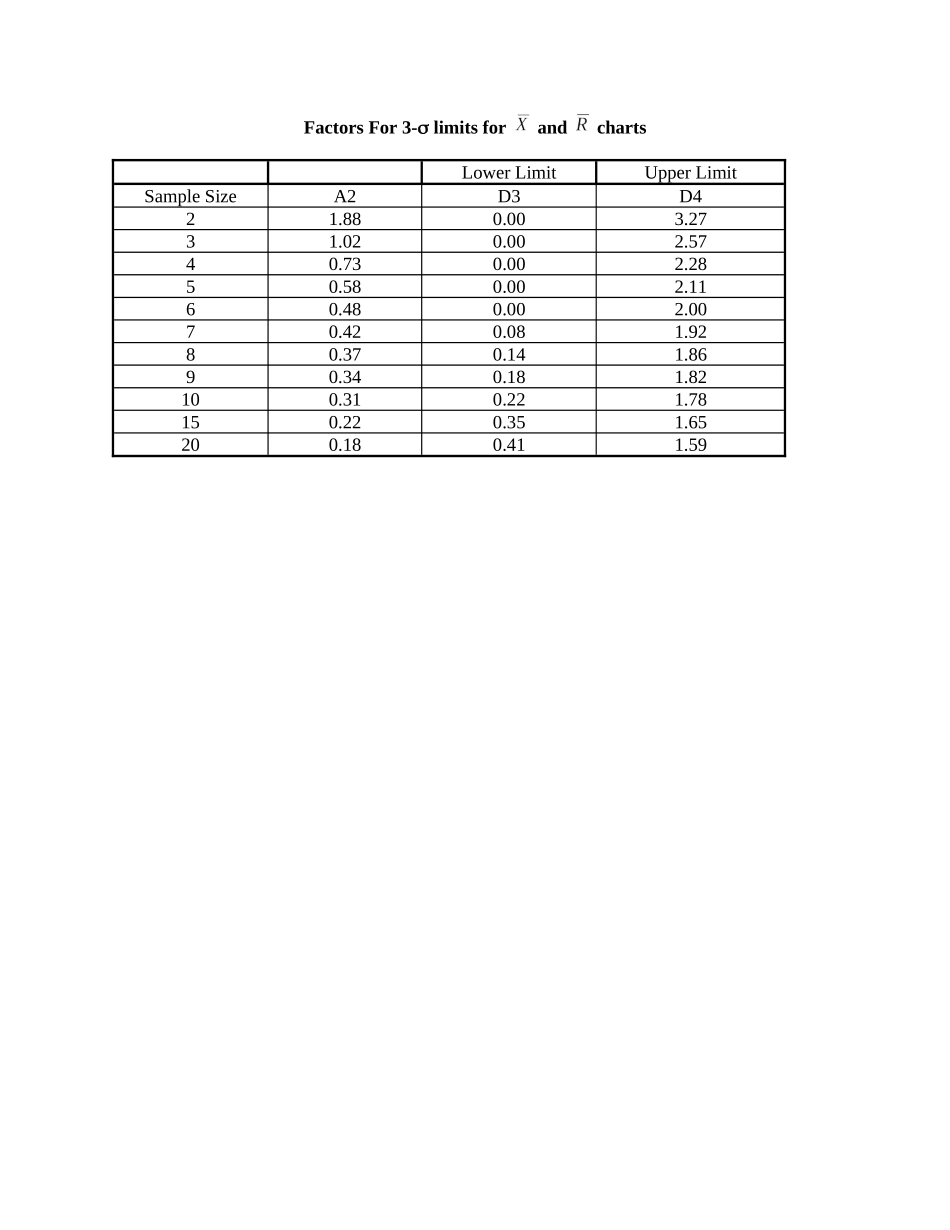
电脑桌面
添加小米粒文库到电脑桌面
安装后可以在桌面快捷访问

spc examplesVIP免费

spc examples_第1页
1/4
spc examples_第2页
2/4
spc examples_第3页
3/4
FactorsFor3-limitsforandchartsLowerLimitUpperLimitSampleSizeA2D3D421.880.003.2731.020.002.5740.730.002.2850.580.002.1160.480.002.0070.420.081.9280.370.141.8690.340.181.82100.310.221.78150.220.351.65200.180.411.
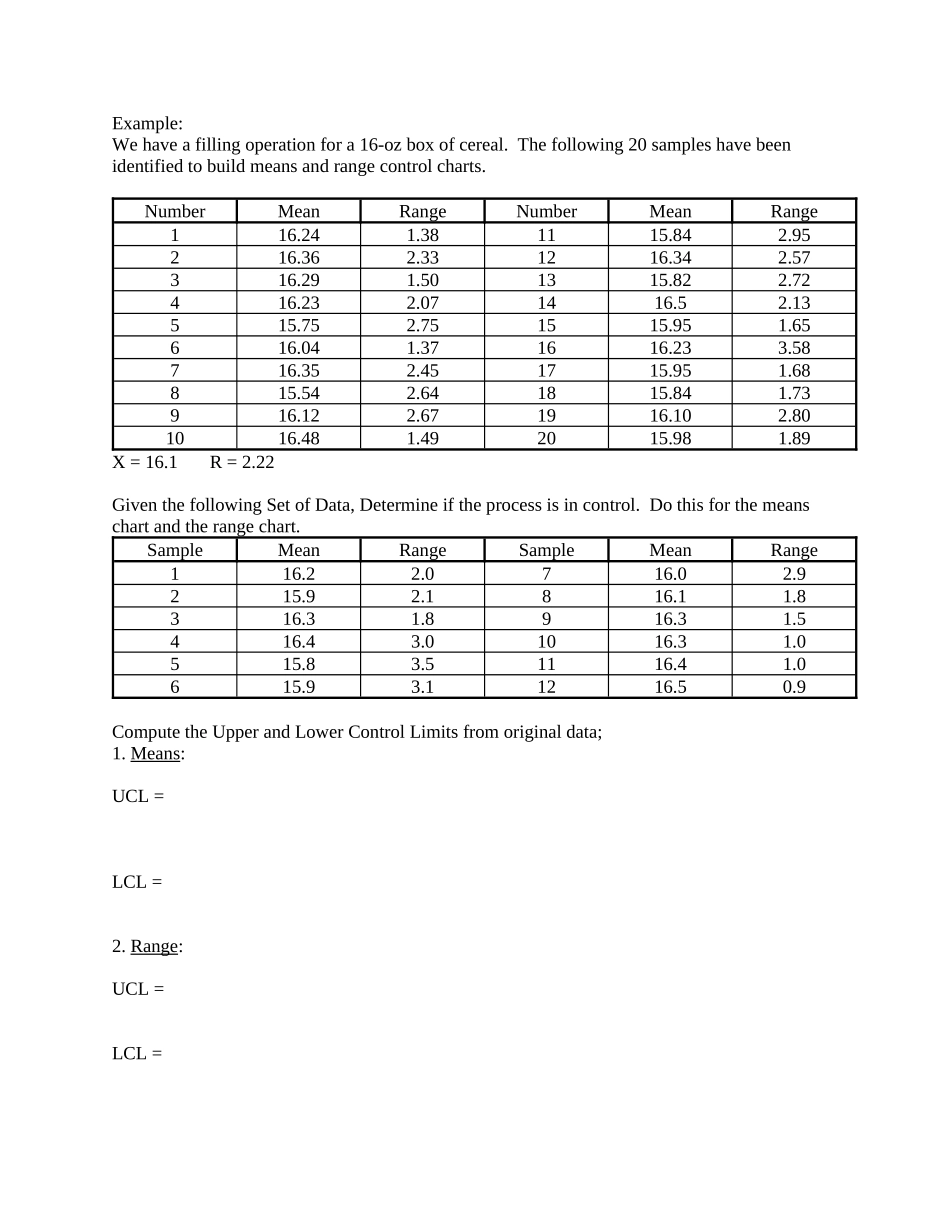
59Example:Wehaveafillingoperationfora16-ozboxofcereal.Thefollowing20sampleshavebeenidentifiedtobuildmeansandrangecontrolcharts.NumberMeanRangeNumberMeanRange116.241.381115.842.95216.362.331216.342.57316.291.501315.822.72416.232.071416.52.13515.752.751515.951.65616.041.371616.233.58716.352.451715.951.68815.542.641815.841.73916.122.671916.102.801016.481.492015.981.89X=16.1R=2.22GiventhefollowingSetofData,Determineiftheprocessisincontrol.Dothisforthemeanschartandtherangechart.SampleMeanRangeSampleMeanRange116.22.0716.02.9215.92.1816.11.8316.31.8916.31.5416.43.01016.31.0515.83.51116.41.0615.93.11216.50.9ComputetheUpperandLowerControlLimitsfromoriginaldata;1.Means:UCL=LCL=2.Range:UCL=LCL=AttributeChartsUsingthefollowinginformation,constructacontrolchartthatwilldescribe95.5percentofthechancevariation.Eachsamplecontains100units.SampleDefectsSampleDefects1141182101212312139413141059151161116107101788121812913191010102016TotalNumberofDefects=220=UCL=LCL=RollsofcoiledwirearemonitoredusingaC-chart.18rollshavebeenexaminedandthenumberofdefectsperrollhasbeenrecorded.Istheprocessincontrol?Use2standarddeviationcontrollimits.SampleDefectsSampleDefectsSampleDefects137413222811443492152451011615111317362124181TotalDefects:45UCL=LCL=

1、当您付费下载文档后,您只拥有了使用权限,并不意味着购买了版权,文档只能用于自身使用,不得用于其他商业用途(如 [转卖]进行直接盈利或[编辑后售卖]进行间接盈利)。
2、本站所有内容均由合作方或网友上传,本站不对文档的完整性、权威性及其观点立场正确性做任何保证或承诺!文档内容仅供研究参考,付费前请自行鉴别。
3、如文档内容存在违规,或者侵犯商业秘密、侵犯著作权等,请点击“违规举报”。

碎片内容

确认删除?
VIP
微信客服
  • 扫码咨询
会员Q群
  • 会员专属群点击这里加入QQ群
客服邮箱
回到顶部