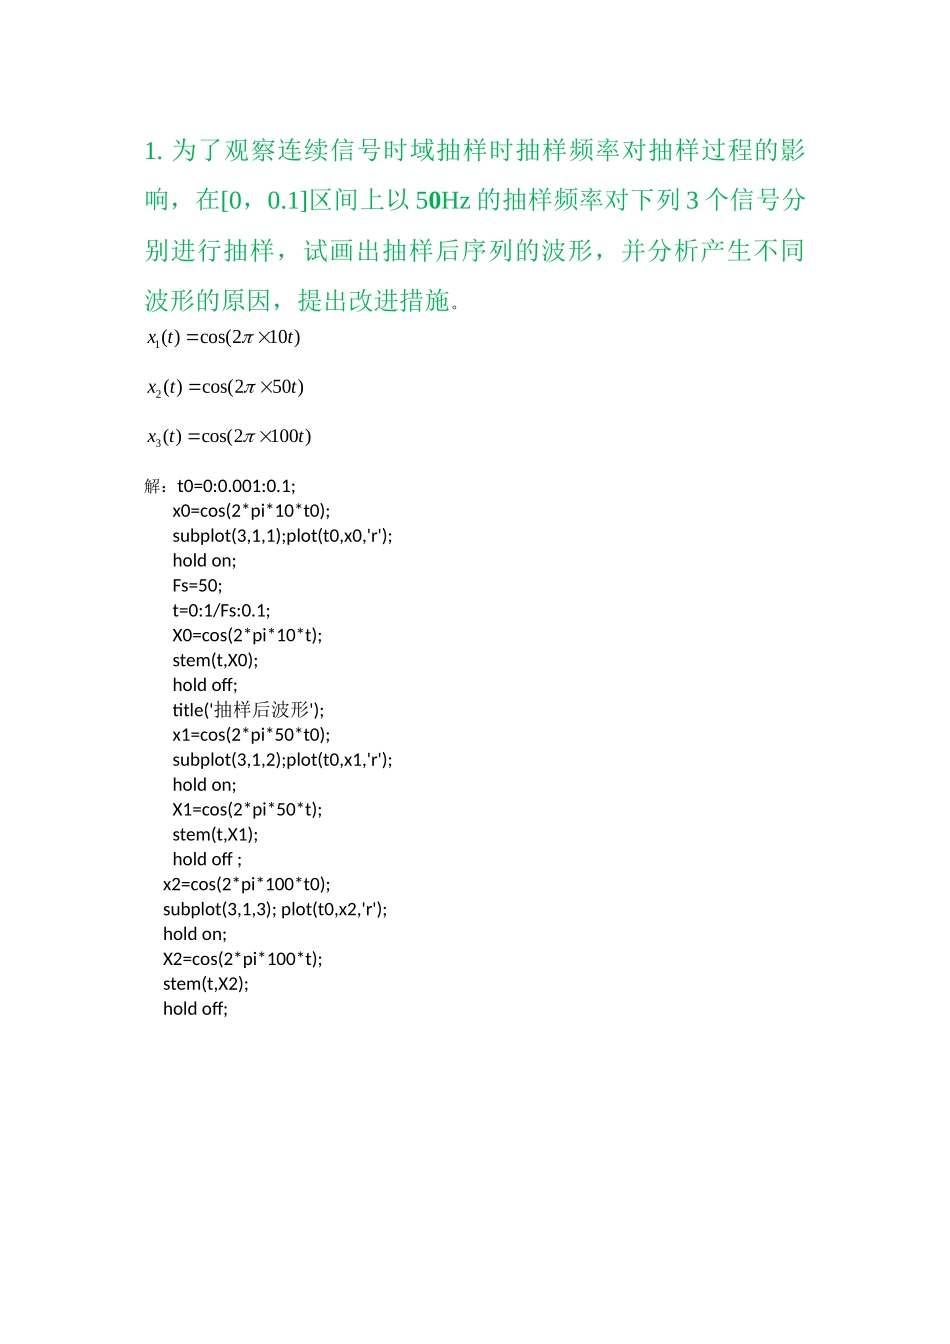
为了观察连续信号时域抽样时抽样频率对抽样过程的影响,在[0,0
1]区间上以50Hz的抽样频率对下列3个信号分别进行抽样,试画出抽样后序列的波形,并分析产生不同波形的原因,提出改进措施
)102cos()(1ttx)502cos()(2ttx)0102cos()(3ttx解:t0=0:0
1;x0=cos(2*pi*10*t0);subplot(3,1,1);plot(t0,x0,'r');holdon;Fs=50;t=0:1/Fs:0
1;X0=cos(2*pi*10*t);stem(t,X0);holdoff;title('抽样后波形');x1=cos(2*pi*50*t0);subplot(3,1,2);plot(t0,x1,'r');holdon;X1=cos(2*pi*50*t);stem(t,X1);holdoff;x2=cos(2*pi*100*t0);subplot(3,1,3);plot(t0,x2,'r');holdon;X2=cos(2*pi*100*t);stem(t,X2);holdoff;00
1-101抽样后波形00
1-10100
1-1012
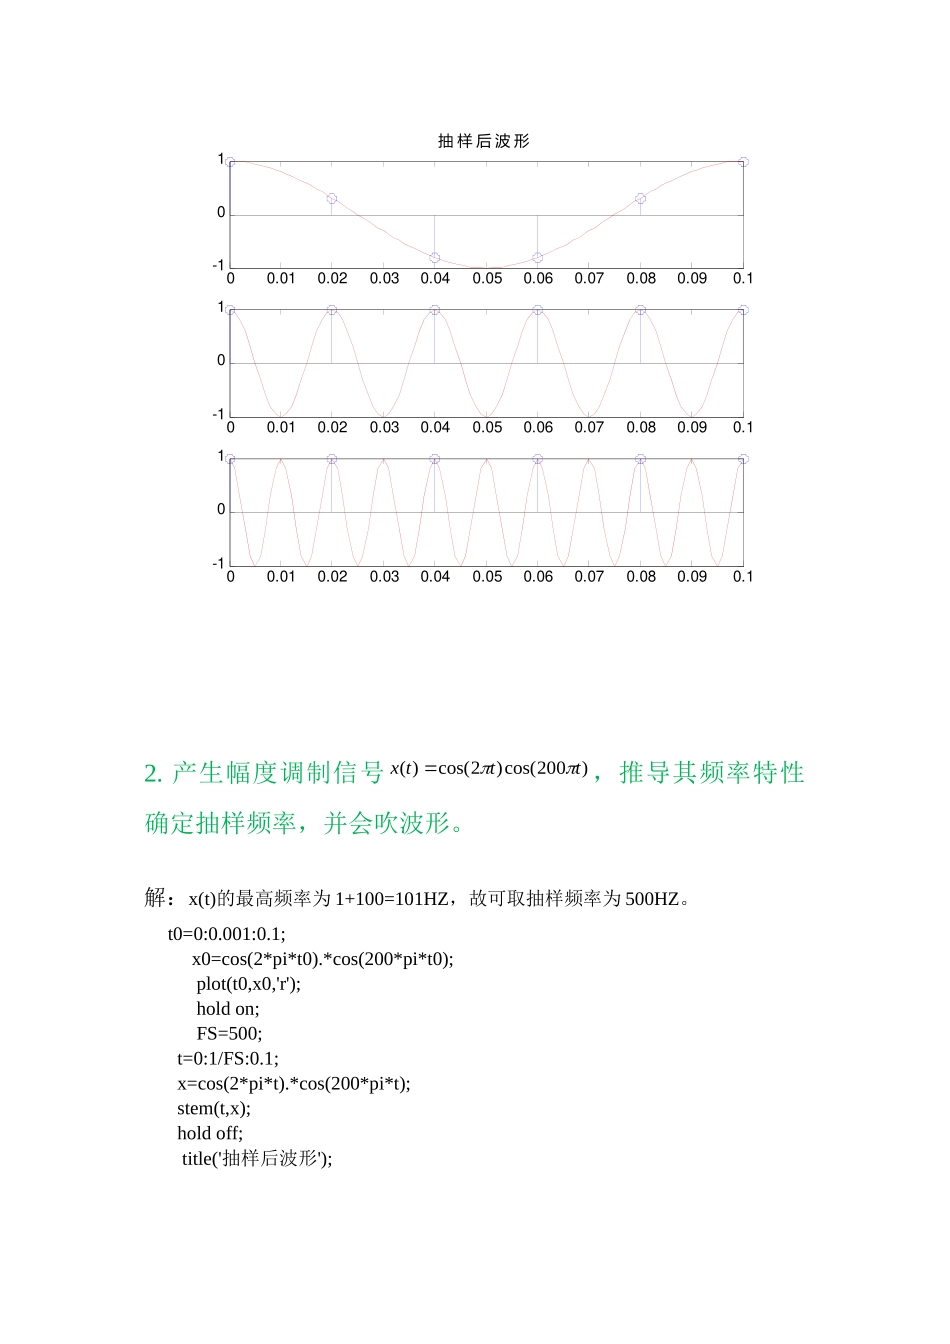
产生幅度调制信号)200cos()2cos()(tttx,推导其频率特性确定抽样频率,并会吹波形
解:x(t)的最高频率为1+100=101HZ,故可取抽样频率为500HZ
t0=0:0
1;x0=cos(2*pi*t0)
*cos(200*pi*t0);pl