实验四 信号的频谱分析 一.实验目的 1.掌握利用FFT 分析连续周期,非周期信号的频谱,如周期,非周期方波,正弦信号等。理解 CFS,CTFT 与 DFT(FFT)的关系。 2.利用FFT 分析离散周期,非周期信号的频谱,如周期,非周期方波,正弦信号等。理解DFS,DTFT 与 DFT(FFT)的关系,并讨论连续信号与离散信号频谱分析方法的异同。 二.实验要求 1.编写程序完成任意信号数字谱分析算法; 2.编写实验报告。 三.实验内容 1.
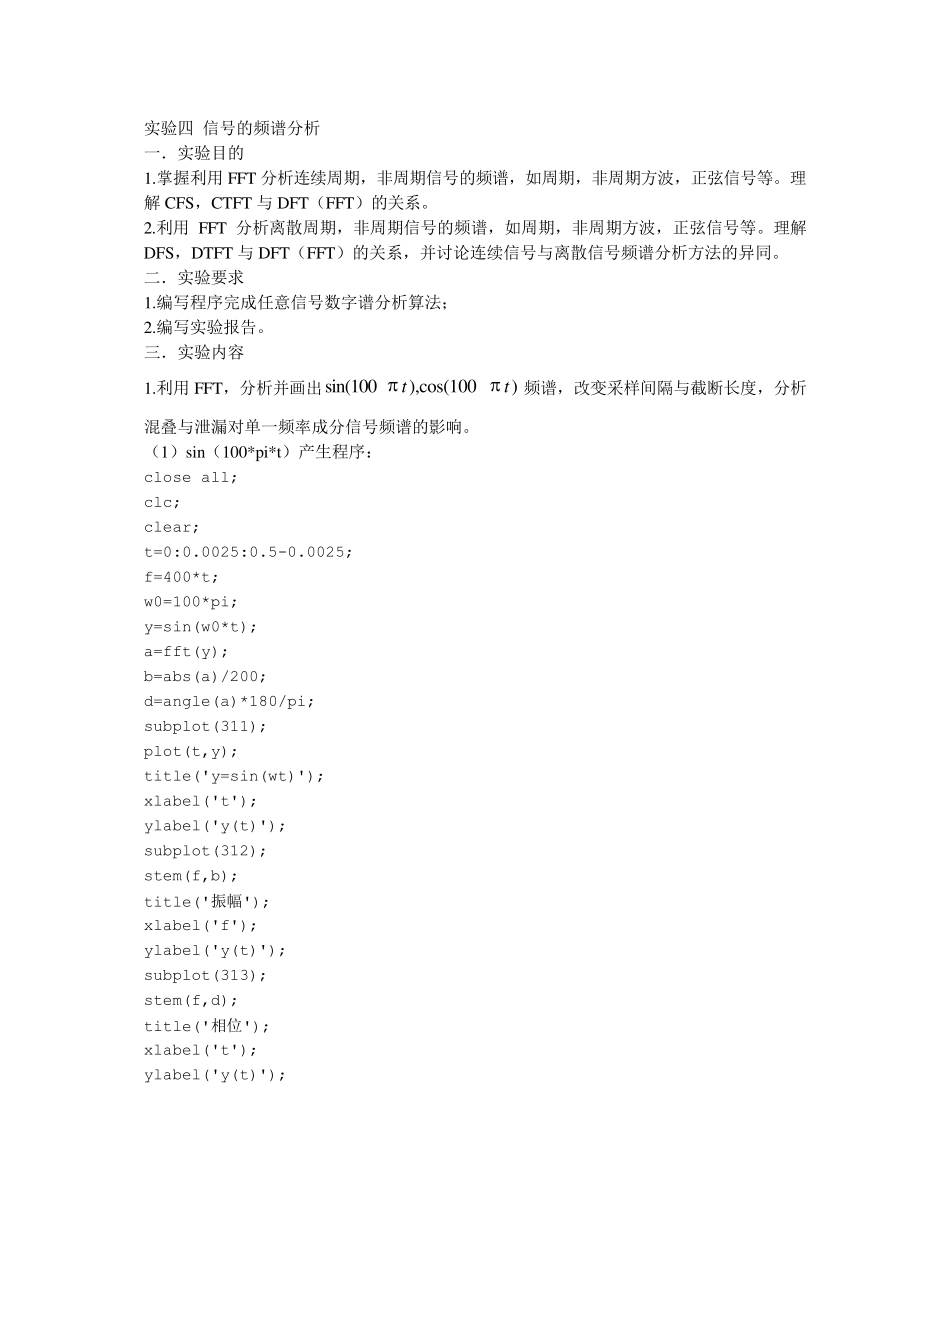
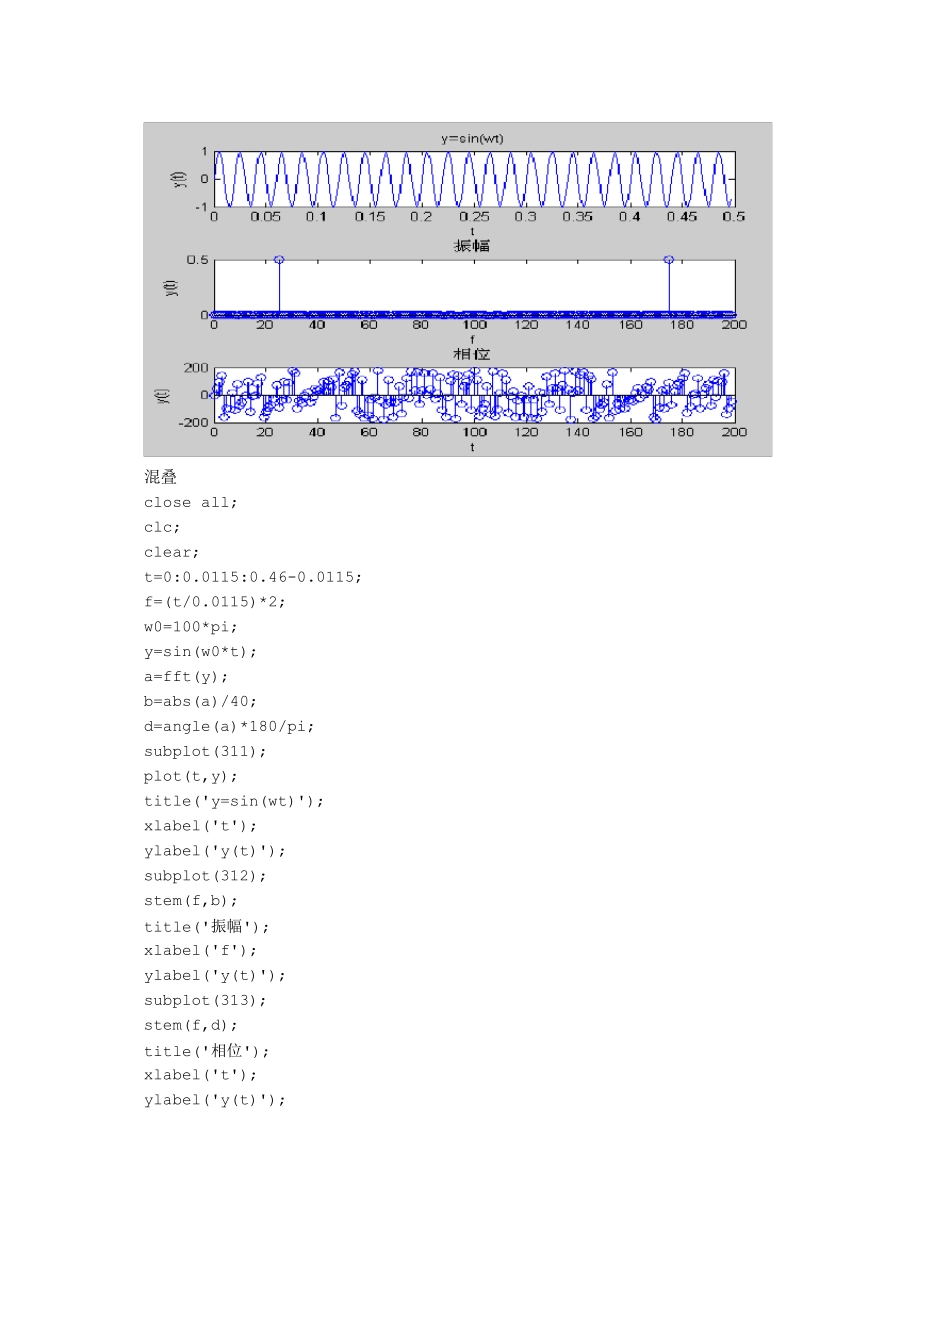
利用FFT,分析并画出sin(100),cos(100)tt频谱,改变采样间隔与截断长度,分析混叠与泄漏对单一频率成分信号频谱的影响。 (1)sin(100*pi*t)产生程序: close all; clc; clear; t=0:0.0025:0.5-0.0025; f=400*t; w0=100*pi; y=sin(w0*t); a=fft(y); b=abs(a)/200; d=angle(a)*180/pi; subplot(311); plot(t,y); title('y=sin(wt)'); xlabel('t'); ylabel('y(t)'); subplot(312); stem(f,b); title('振幅'); xlabel('f'); ylabel('y(t)'); subplot(313); stem(f,d); title('相位'); xlabel('t'); ylabel('y(t)'); 混叠 close all; clc; clear; t=0:0.0115:0.46-0.0115; f=(t/0.0115)*2; w0=100*pi; y=sin(w0*t); a=fft(y); b=abs(a)/40; d=angle(a)*180/pi; subplot(311); plot(t,y); title('y=sin(wt)'); xlabel('t'); ylabel('y(t)'); subplot(312); stem(f,b); title('振幅'); xlabel('f'); ylabel('y(t)'); subplot(313); stem(f,d); title('相位'); xlabel('t'); ylabel('y(t)'); 泄漏 close all; clc; clear; t=0:0.0025:0.5-0.0075; f=800*t; w0=100*pi; y=sin(w0*t); a=fft(y); b=abs(a)/198; d=angle(a)*180/pi; subplot(311); plot(t,y); title('y=sin(wt)'); xlabel('t'); ylabel('y(t)'); subplot(312); stem(f,b); title('振幅'); xlabel('f'); ylabel('y(t)'); subplot(313); stem(f,d); title('相位'); xlabel('t'); ylabel('y(t)'); (2)cos(100*pi*t); close all; clc; clear; t=0:0.0025:0.5-0.0025; f=800*t; w0=100*pi; y=cos(w0*t); a=fft(y); b=abs(a)/200; d=angle(a)*180/pi; subplot(311); plot(t,y); title('y=cos(wt)'); xlabel('t'); ylabel('y(t)'); grid on; hold on; subplot(312); stem(f,b); title('振幅'); xlabel('f'); ylabel('y(t)'); grid on; hold...