XHProf 这个软件本是Facebook 内部的一个应用工具,2009 年3 月份开源,为PHP 的性能监测提供了很好的工具
官方的介绍中提到: XHProf is a hierarchical profiler for PHP
It reports function-level call counts and inclusive and exclusive metrics such as wall (elapsed) time, CPU time and memory usage
XHProf's light-weight nature and aggregation capabilities make it well suited for collecting "function-level" performance statistics from production environments
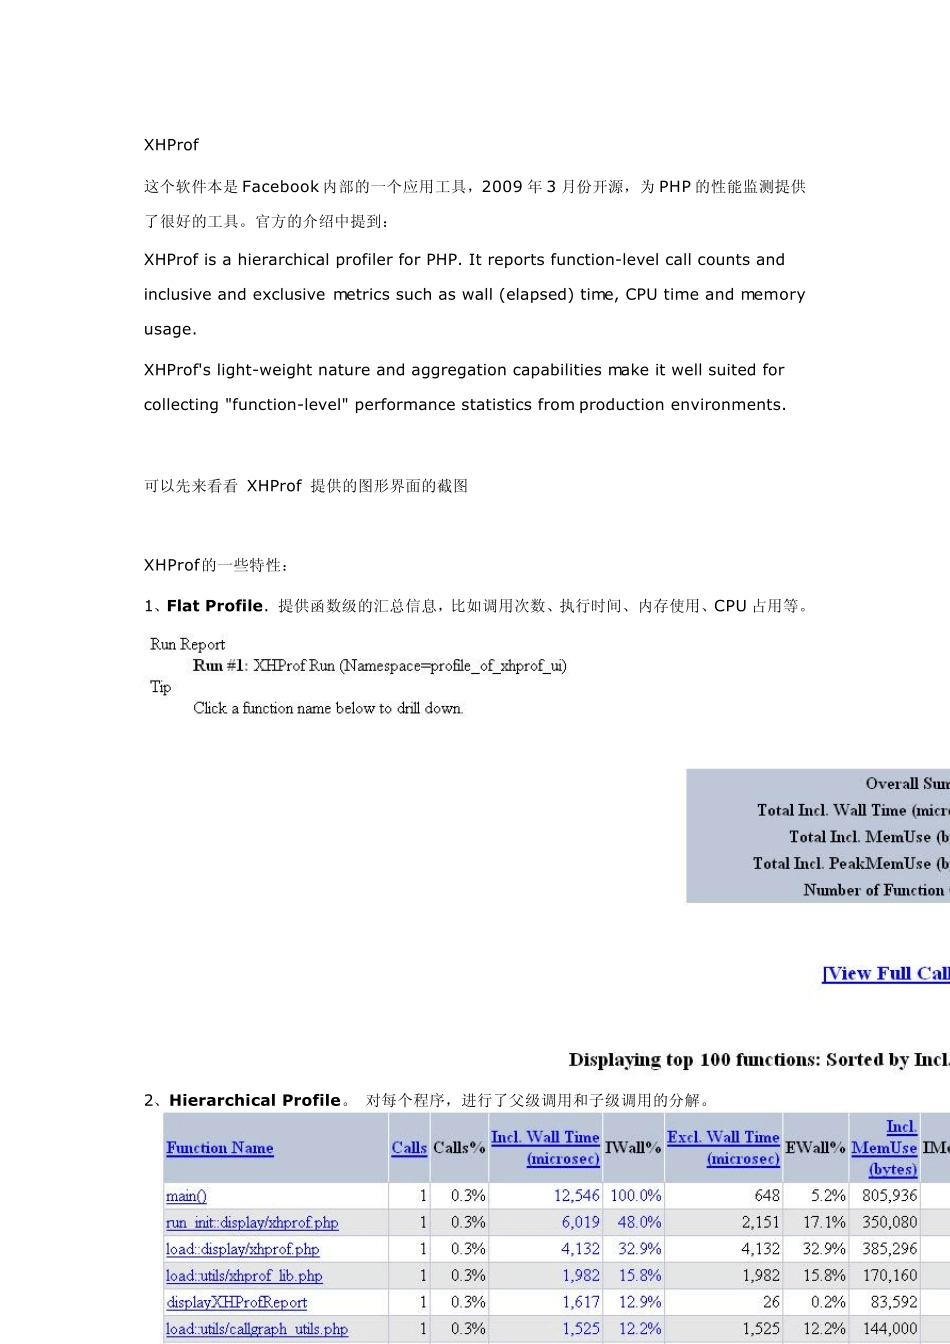
可以先来看看 XHProf 提供的图形界面的截图 XHProf的一些特性: 1、Flat Profile
提供函数级的汇总信息,比如调用次数、执行时间、内存使用、CPU 占用等
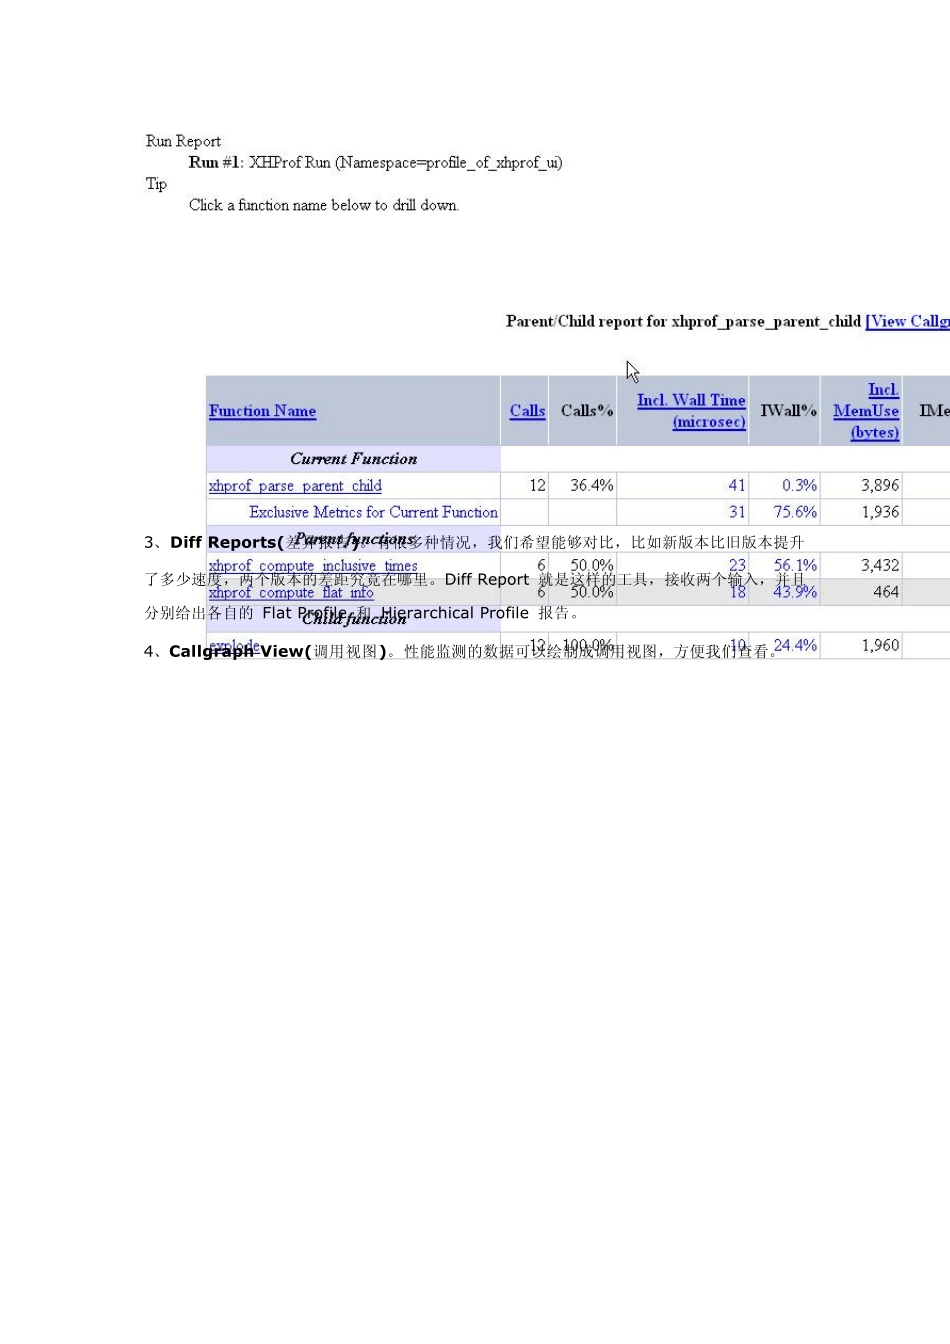
2、Hierarchical Profile
对每个程序,进行了父级调用和子级调用的分解
3、Diff Reports(差异报告)
有很多种情况,我们希望能够对比,比如新版本比旧版本提升了多少速度,两个版本的差距究竟在哪里
Diff Report 就是这样的工具,接收两个输入,并且分别给出各自的 Flat Profile 和 Hierarchical Profile 报告
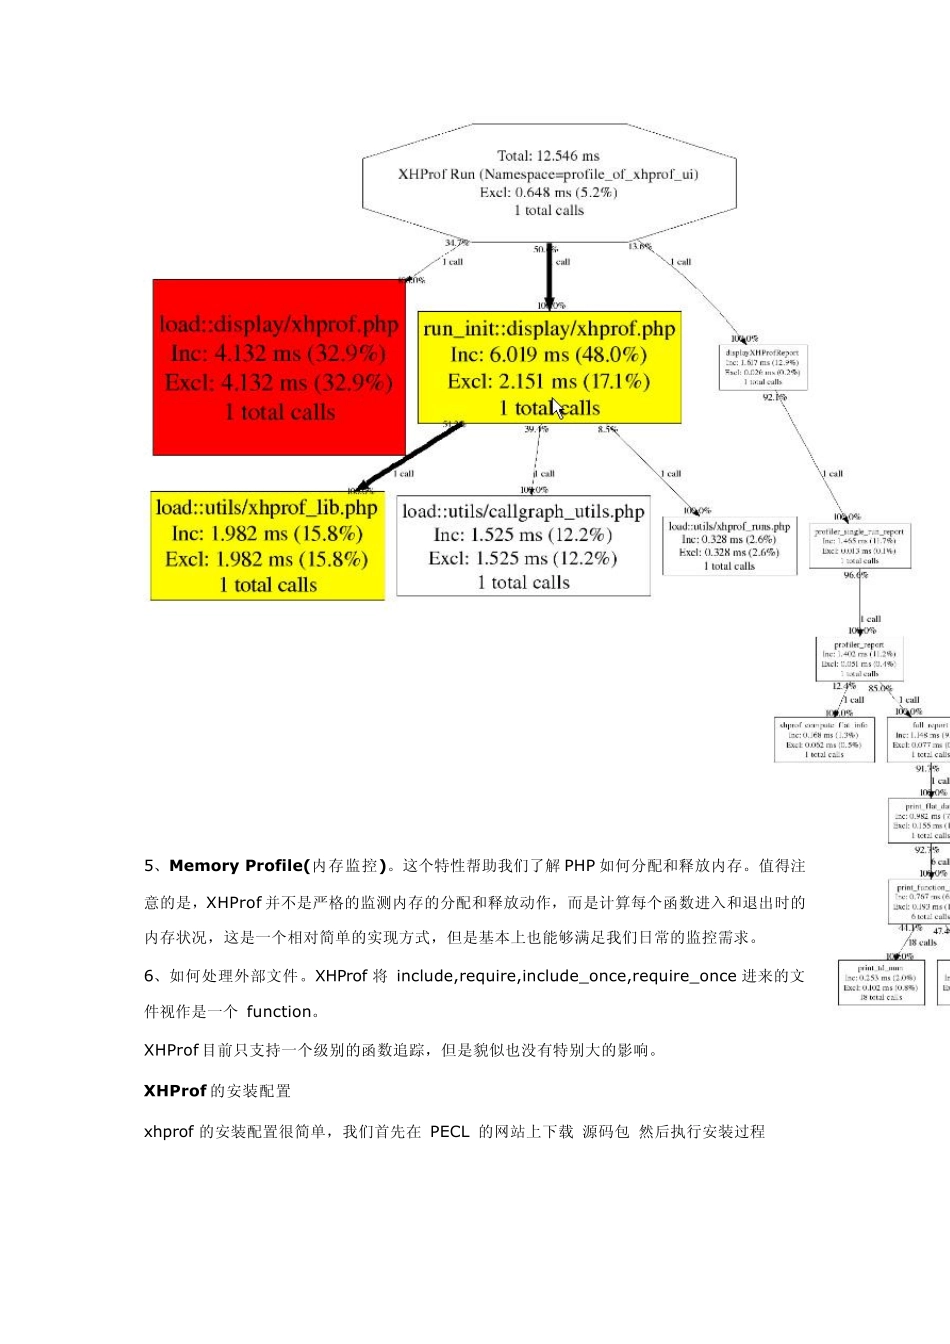
4、Callgraph View (调用视图)
性能监测的数据可以绘制成调用视图,方便我们查看
5、Memory Profile(内存监控)
这个特性帮助我们了解 PHP 如何分配和释放内存
值得注意的是