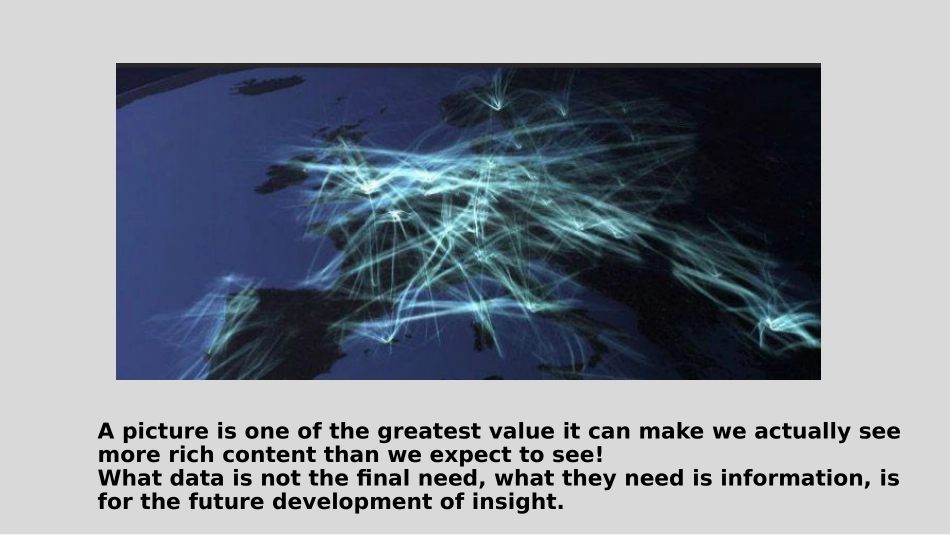
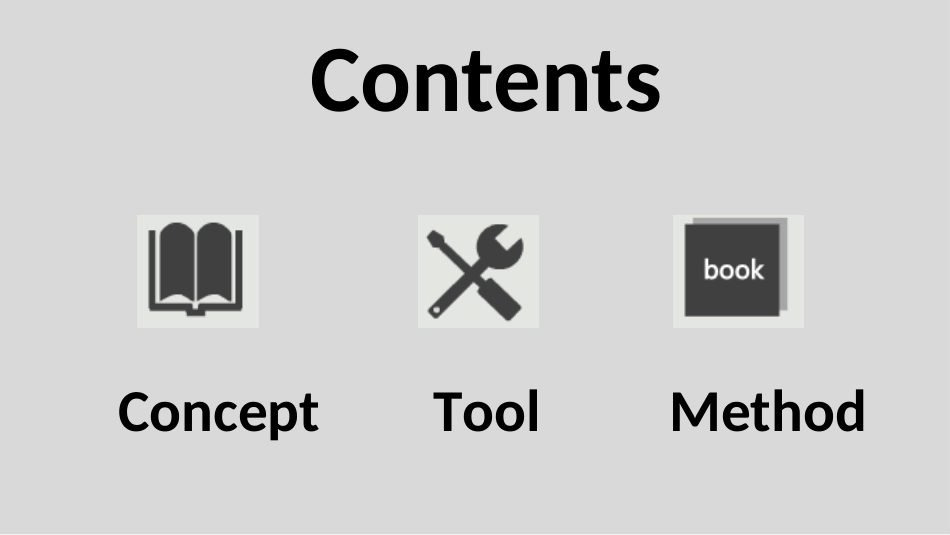
DatavisualizationApictureisoneofthegreatestvalueitcanmakeweactuallyseemorerichcontentthanweexpecttosee!Whatdataisnotthefinalneed,whattheyneedisinformation,isforthefuturedevelopmentofinsight.ContentsConceptToolMethodConcept•Datavisualizationisthestudyofthevisualrepresentationofdata,thevisualformofthedataisdefinedas:asummaryinsomeformofinformationextraction,includingthevariouspropertiesofthecorrespondinginformationunitandvariables.——baiduencyclopedia•Bymeansofgraphicalmethod,cleareffectivelyconveyinformationandcommunication.——wikipedia•ScientificvisualizationScientificvisualizationmainlyfocusesonthephenomenonof3dvisualization,suchasarchitecture,meteorology,medicineorbiologysystem.Focusonthebody,faceandlightsourcesuchasrealisticrendering.•InformationvisualizationInformationvisualizationisdesignedtostudylarge-scalenonnumericinformationresourcesothervisualpresentation,andusingthetechnologyofgraphicimages,andthemethod,helppeopletounderstandandanalyzethedata.•Comparedwithscientificvisualization,informationvisualizationisfocusontheabstractdatasets,suchasunstructuredtextorpointofhighdimensionalspace(thesepointsdonothavetheinherenttwo-dimensionalorthree-dimensionalgeometricstructure).Scientificvisualization:medicalimagesoftheshadowInformationvisualization:NewYorkCitycrimemapsVSStackfigureBubblechartMatrixgraphTagcloudParallelaxisMapTimeline,Linechart,Scatterdiagram,Datatable,Flowchart,Radarmap......Heatmapcanbeveryintuitivetopresentsomedifficulttounderstandortoexpressthedata,suchasdensity,frequency,temperature,etc.,toswitchtothisareaandcoloraremorelikelytobeunderstood.HeatmapThisvisualizationisveryintuitivereflecttheInternetwebsiteoverallproportionoftypes,TreeTapisaverytypicalapplicationscenario,useaTreeMapinthefullymanifestedintuitively,atthesamelevelatthesametimeunderthesametypeanddifferenttypesforthesubsetsizecomparison.TreeTapToolEntry-leveltoolsAdvancedtoolsExperttools•Excel•CSV/JSON•Processing•NodeBox•R•Weka•GephiOnlinedatavisualizationtoolsMappingtoolsInteractivegraphicaluserinterfacecontrol•Flot•D3•Raphael•Visual.ly•GoogleCharAPI•Leaflet•OpenLayers•PolyMaps•Kartograph•ModestMaps•CartoDB•Tangle•CrossfilerExcel•Excelgraphicalfunctionisnotpowerful,butExcelisanidealworktoanalyzethedata.•Asastarterkit,Excelisanidealtooltoquicklyanalyzedata,andcreateadatagraphforinternaluse,butExcelincolors,linesandpatternsontheoptionalscopeislimited,thisalsomeansthatusingExcelisdifficulttoproducecanmettheneedoftheprofessionalpublicationsandwebsitedata.Butasanefficientinternalcommunicationtool,Excelissupposedtobeoneofthenecessarytoolsinyourchest.In2015China'sprovinceGDPrankingbarchartIn2015China'sprovinceGDPrankingbubblechartIn2015China'sprovinceGDPrankingRegionalfigureGanttchartRadarmapVisually•Tools:http://visual.ly/•Visual.LyCreatecanallowyoufromTwitter,Facebook,andPlussocialnetworkingsitessuchascollectdata,supportprovidefivekindsofVisualtemplate.Forexampleanalysisyouaccountforyourfriendtobuildadescriptionofitsfootprintinformationfigure,oryourfavoritepicturesandarticles,orperhapsyouTwittertagandsoon.•Usingthree-dimensionaleffect,inordertoshowthechangesofageandcontrastratioineachyear.ThecapitalofFinlandpeople'sageandleverageGooglechart•Tools:Googlechart•Source:worldbank•Analysis:ingeneral,themoretheeconomicdevelopedarea,thelongerthelifeexpectancy,butthelowerconceptionrate.Forexample,inthecentralAfricanrepubliclifeexpectancyisonly48.3yearsold,andtheconceptionrateis4.55.Asacomparison,welookatmacau,theaveragelifeexpectancyof81yearsofage,andrateofonly1.12.DivisionofthebreedingrateandthedistributionoftheaveragelifeexpectancyMethodDatavisualizationofsevenstages1.obtain,Thedatasource2.Analysis,Thedatastructure3.filter,Payattentiontotheinformation4.mining,Thestatisticalanalysis5.describe,Visualmodel6.modified,Clearandeasytounderstand7.interaction,OperationalcontrolHowtoanalysis?•Whoaretheusersofthedata?•Whatkindofdatatheyneed?•Whoaretheusersofthedata?•Iftheuserisnotyou!•Thenwhat'stheirpreference?•Whatistheirfirstchoice?•Dowereallyunderstandthem?!•Wanttosay?•Wanttosolvetheproblemofwhatkindof?•Whethercanrealize?Howdoyoudeterminethedatacontent?Whatarethedatacategory?•Classification(suchas:column)•Sequence(suchas:ranking,time)•Number(suchas:digital)•Relationship(suchas:level,influence,etc.)•locationHowtherelationshipbetweentheperformancedata?•Throughthedifferentpositionsaid•Trytouseavarietyofcoordinateaxes•Consideringhowtodefinetheformat•Usedifferenttypesofcolor•UsingtheappropriateperformancepresentnumericalattributesDataattributesandpresentation?•Digitaldata•Graphicdata•Symbolicdata•Physicaldata•NumericalattributesThankyouforwatching谢谢观赏!