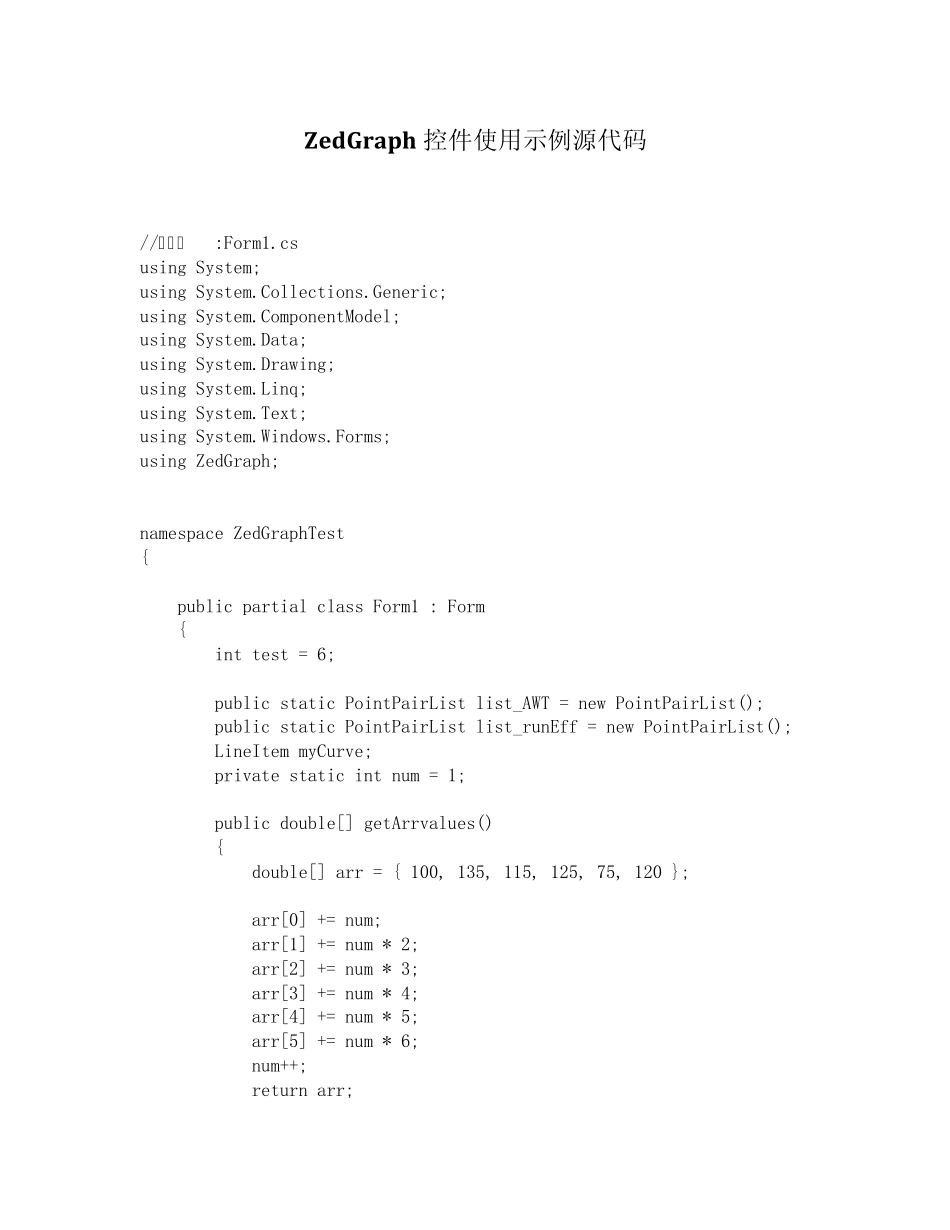
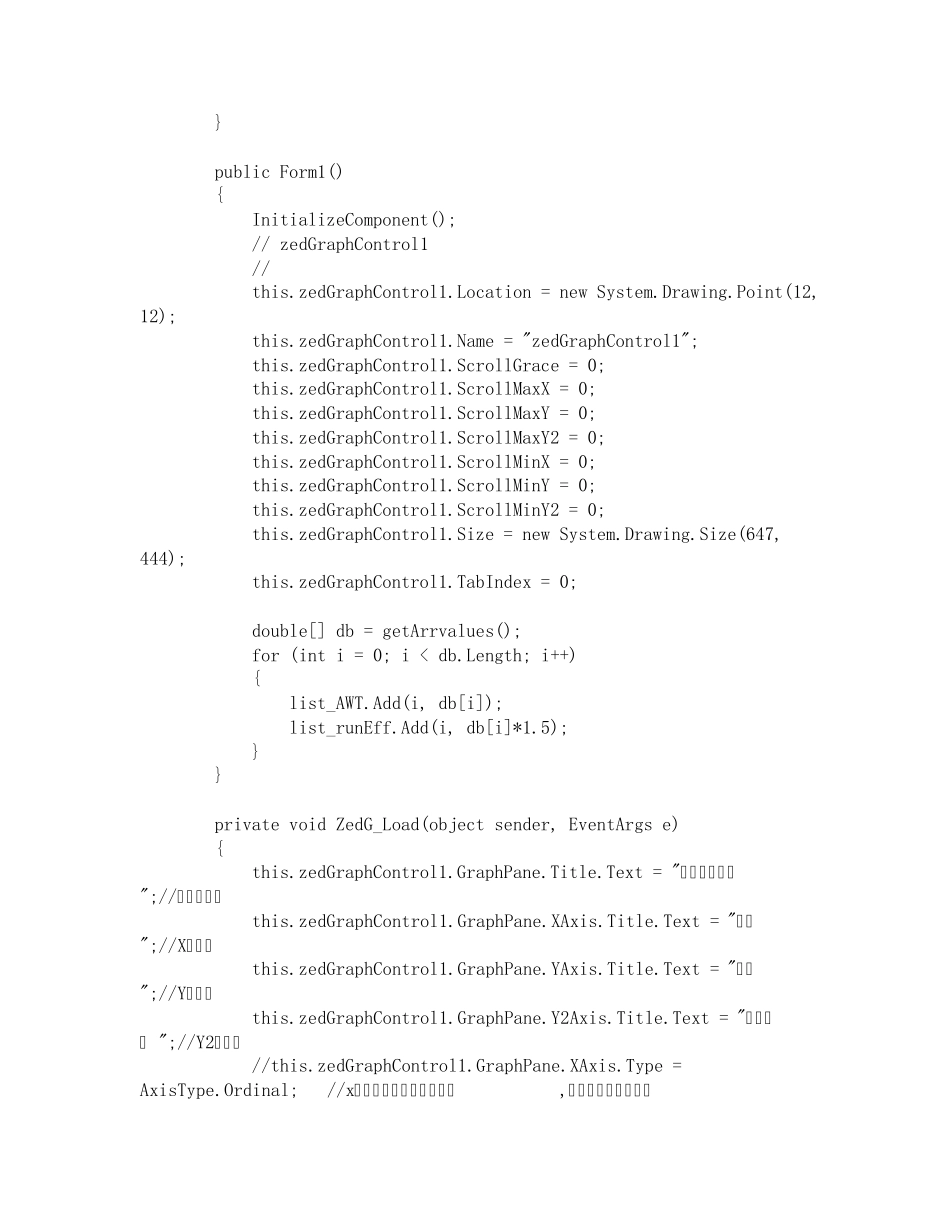
ZedGraph 控件使用示例源代码 //文件名:Form1.cs using System; using System.Collections.Generic; using System.ComponentModel; using System.Data; using System.Drawing; using System.Linq; using System.Text; using System.Windows.Forms; using ZedGraph; namespace ZedGraphTest { public partial class Form1 : Form { int test = 6; public static PointPairList list_AWT = new PointPairList(); public static PointPairList list_runEff = new PointPairList(); LineItem myCurve; private static int num = 1; public double[] getArrvalues() { double[] arr = { 100, 135, 115, 125, 75, 120 }; arr[0] += num; arr[1] += num * 2; arr[2] += num * 3; arr[3] += num * 4; arr[4] += num * 5; arr[5] += num * 6; num++; return arr; } public Form1() { InitializeComponent(); // zedGraphControl1 // this.zedGraphControl1.Location = new System.Drawing.Point(12, 12); this.zedGraphControl1.Name = "zedGraphControl1"; this.zedGraphControl1.ScrollGrace = 0; this.zedGraphControl1.ScrollMaxX = 0; this.zedGraphControl1.ScrollMaxY = 0; this.zedGraphControl1.ScrollMaxY2 = 0; this.zedGraphControl1.ScrollMinX = 0; this.zedGraphControl1.ScrollMinY = 0; this.zedGraphControl1.ScrollMinY2 = 0; this.zedGraphControl1.Size = new System.Drawing.Size(647, 444); this.zedGraphControl1.TabIndex = 0; double[] db = getArrvalues(); for (int i = 0; i < db.Length; i++) { list_AWT.Add(i, db[i]); list_runEff.Add(i, db[i]*1.5); } } private void ZedG_Load(object sender, EventArgs e) { this.zedGraphControl1.GraphPane.Title.Text = "楼市运行参数";//图表主标题 this.zedGraphControl1.GraphPane.XAxis.Title.Text = "时间";//X轴标题 this.zedGraphControl1.GraphPane.YAxis.Title.Text = "楼价";//Y轴标题 this.zedGraphControl1.GraphPane.Y2Axis.Title.Text = "楼盘数量 ";//Y2轴标题 //this.zedGraphControl1.GraphPane.XAxis.Type = AxisType.Ordinal; //x轴的最小刻度更变大一点,...


