1 Microeconomics, 4e (Perloff) Chapter 5 Applying Consumer Theory 5.
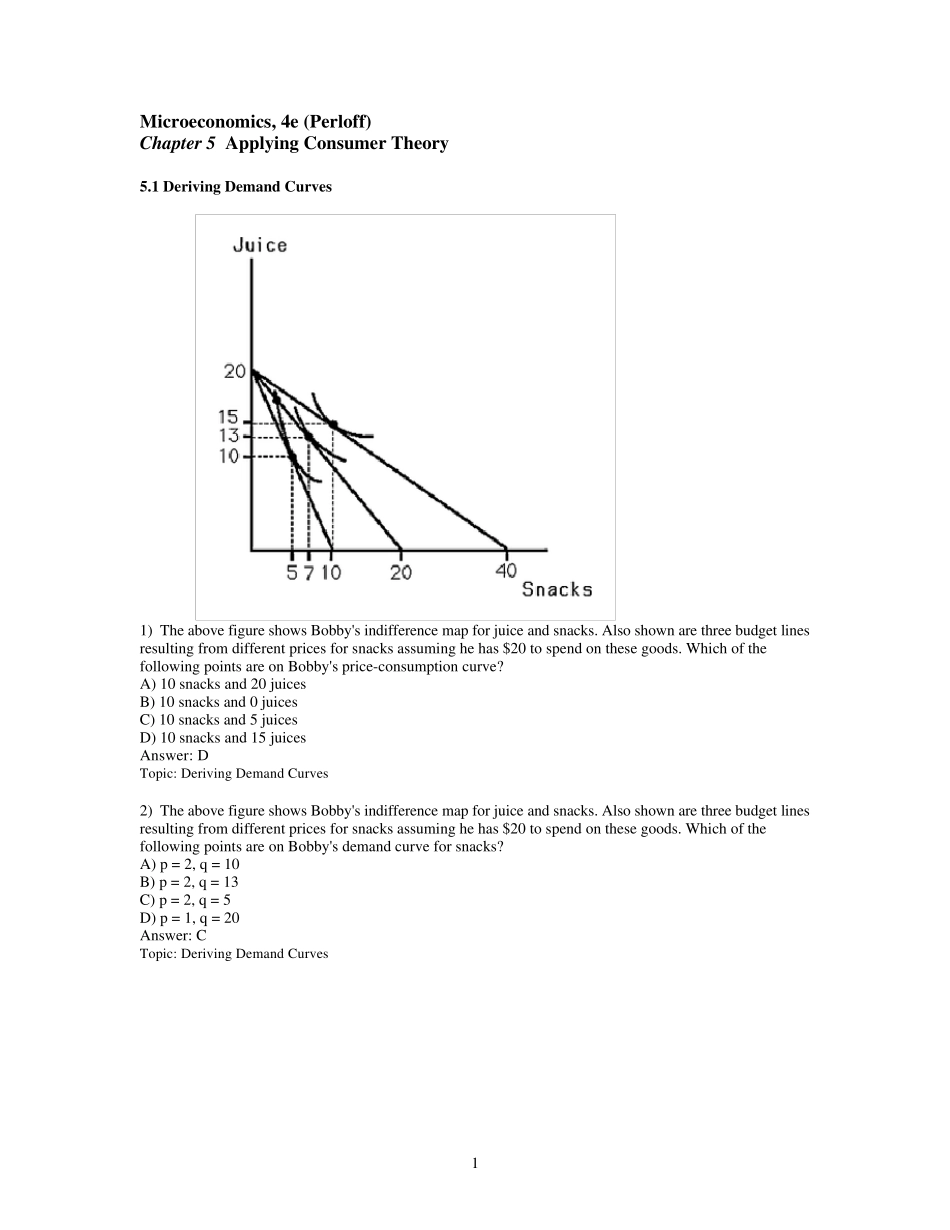
1 Deriving Demand Curves 1) The above figure shows Bobby's indifference map for juice and snacks. Also shown are three budget lines resulting from different prices for snacks assuming he has $20 to spend on these goods. Which of the following points are on Bobby's price-consumption curve? A) 10 snacks and 20 juices B) 10 snacks and 0 juices C) 10 snacks and 5 juices D) 10 snacks and 15 juices Answer: D Topic: Deriving Demand Curves 2) The above figure shows Bobby's indifference map for juice and snacks. Also shown are three budget lines resulting from different prices for snacks assuming he has $20 to spend on these goods. Which of the following points are on Bobby's demand curve for snacks? A) p = 2, q = 10 B) p = 2, q = 13 C) p = 2, q = 5 D) p = 1, q = 20 Answer: C Topic: Deriving Demand Curves 2 3) The above figure shows Bobby's indifference map for juice and snacks. Also shown are three budget lines resulting from different prices for snacks. This information could be used to determine A) the slope of Bobby's demand curve for juice. B) the amount by which Bobby's demand curve for juice shifts when his income rises. C) the amount by which Bobby's demand curve for juice shifts when the price of snacks rises. D) All of the above. Answer: C Topic: Deriving Demand Curves 4) The above figure shows Bobby's indifference map for juice and snacks. Also shown are three budget lines resulting from different prices for snacks. As the price of snacks rises, Bobby's utility A) stays the same. B) increases. C) decreases. D) might change, but there is not enough information to determine. Answer: C Topic: Derivin...