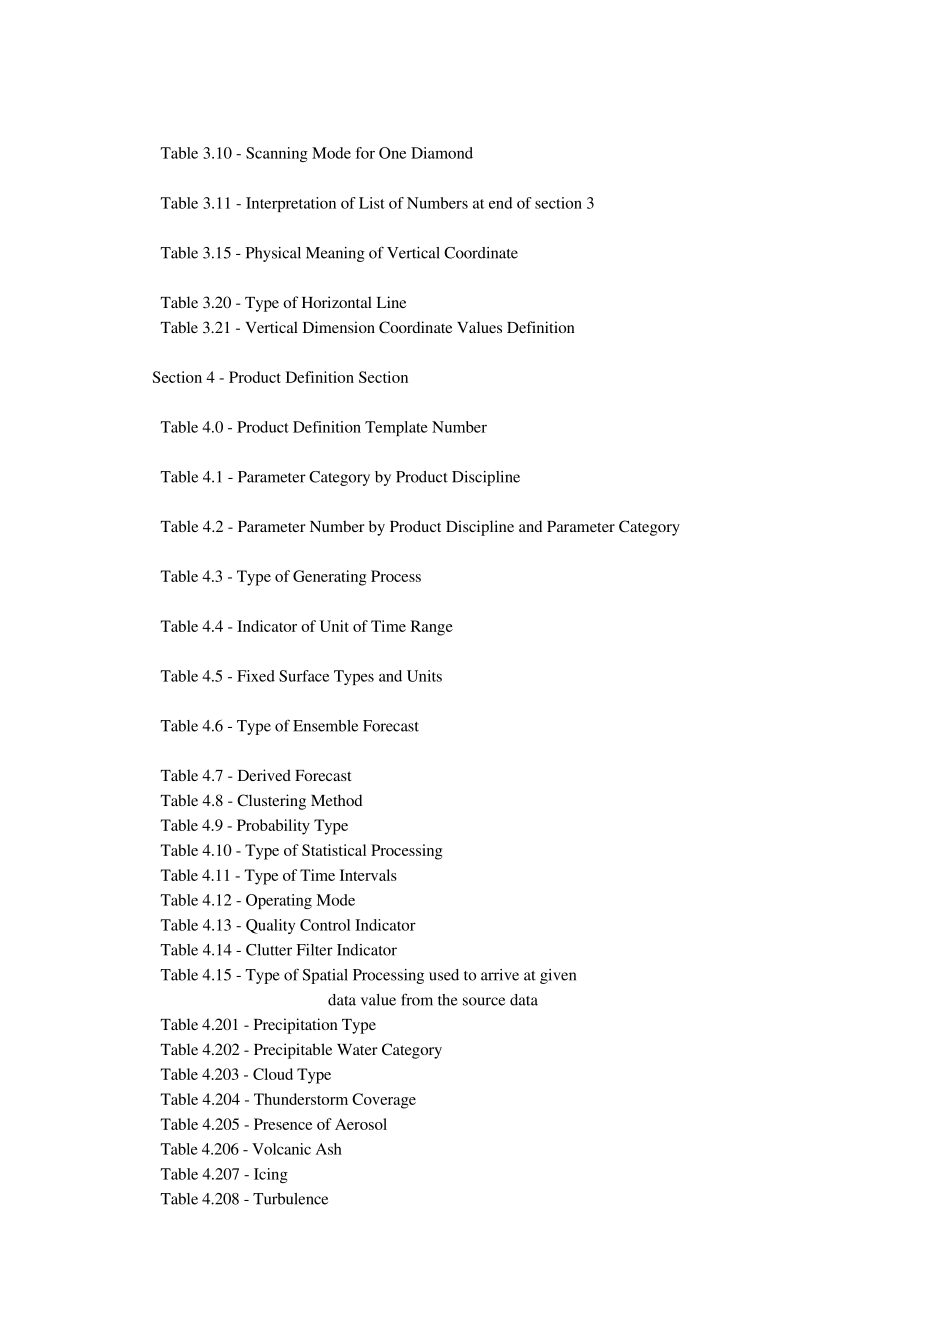
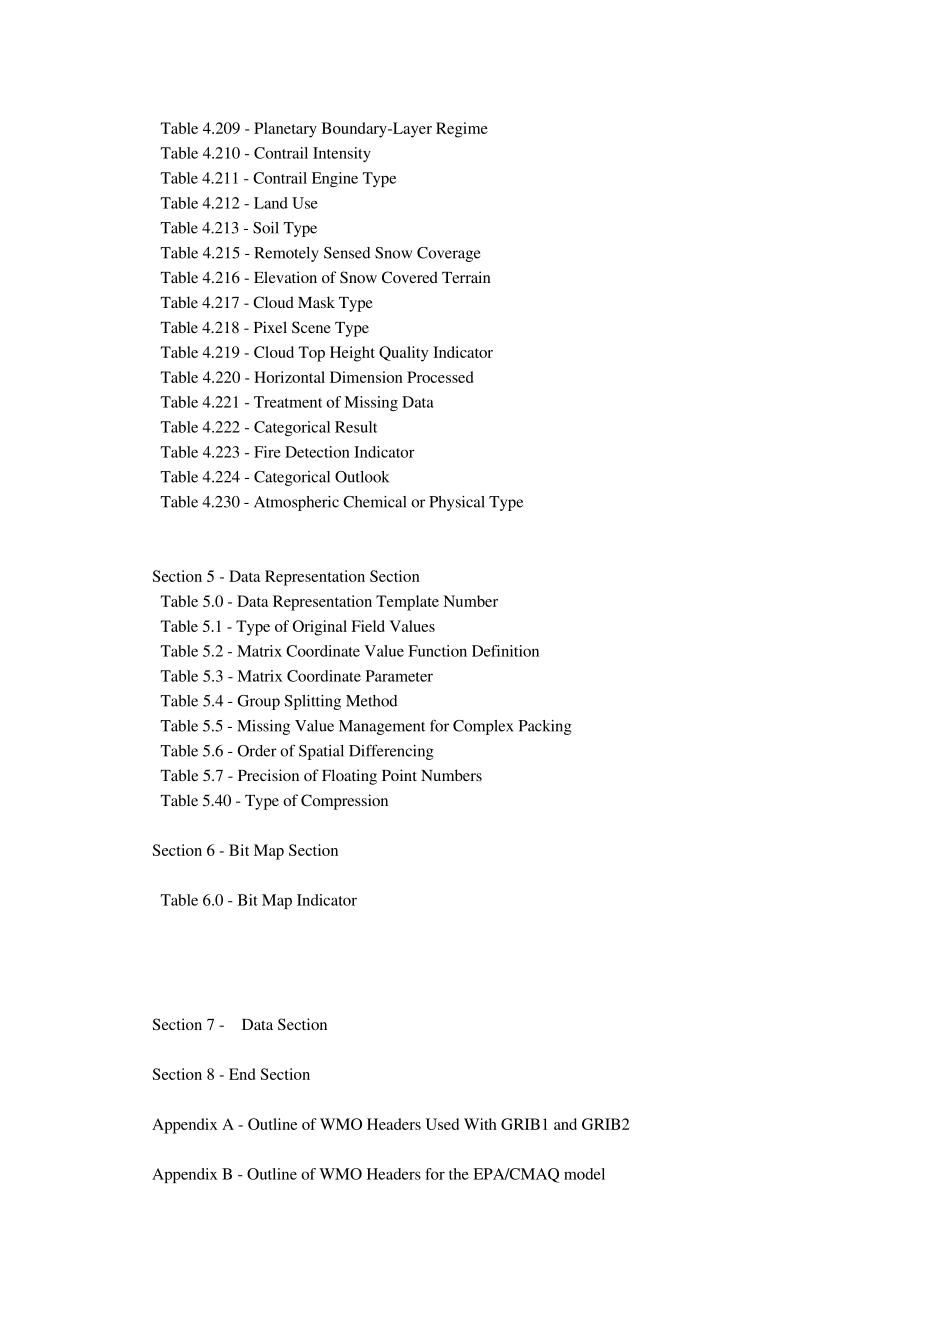
Introdu ction Rev ision History Section 0 - Indicator Section Table 0.0 - Discipline of Processed Data Section 1 - Identification Section Table 1.0 - GRIB Master Tables Version Nu mber Table 1.1 - GRIB Local Tables Version Nu mber Table 1.2 - Significance of Reference Time Table 1.3 - Produ ction Statu s of Data Table 1.4 - Ty pe of Data Section 2 - Local Use Section Section 3 - Grid Definition Section Table 3.0 - Sou rce of Grid Definition Table 3.1 - Grid Definition Template Nu mber Table 3.2 - Shape of the Earth Table 3.3 - Resolu tion and Component Flags Table 3.4 - Scanning Mode Table 3.5 - Projection Center Table 3.6 - Spectral Data Representation Ty pe Table 3.7 - Spectral Data Representation Mode Table 3.8 - Grid Point Position Table 3.9 - Nu mbering Order of Diamonds Table 3.10 - Scanning Mode for One Diamond Table 3.11 - Interpretation of List of Numbers at end of section 3 Table 3.15 - Physical Meaning of Vertical Coordinate Table 3.20 - Type of Horizontal Line Table 3.21 - Vertical Dimension Coordinate Values Definition Section 4 - Product Definition Section Table 4.0 - Product Definition Template Number Table 4.1 - Parameter Category by Product Discipline Table 4.2 - Parameter Number by Product Discipline and Parameter Category Table 4.3 - Type of Generating Process Table 4.4 - Indicator of Unit of Time Range Table 4.5 - Fixed Surface Types and Units Table 4.6 - Type of Ensemble Forecast Table 4.7 - Derived Forecast Table 4.8 - Clustering Method Table 4.9 - Probability Type Table 4.10 - Type of Statistical Processing Table 4.11 - Type of Time Intervals Table 4.12 - Operating Mode Table 4.13 - Quality Control Indicator Table 4.14 - Clutter Filter Indicator Ta...


