线图:例:Direction: You should spend no more than 20 minutes on this task.
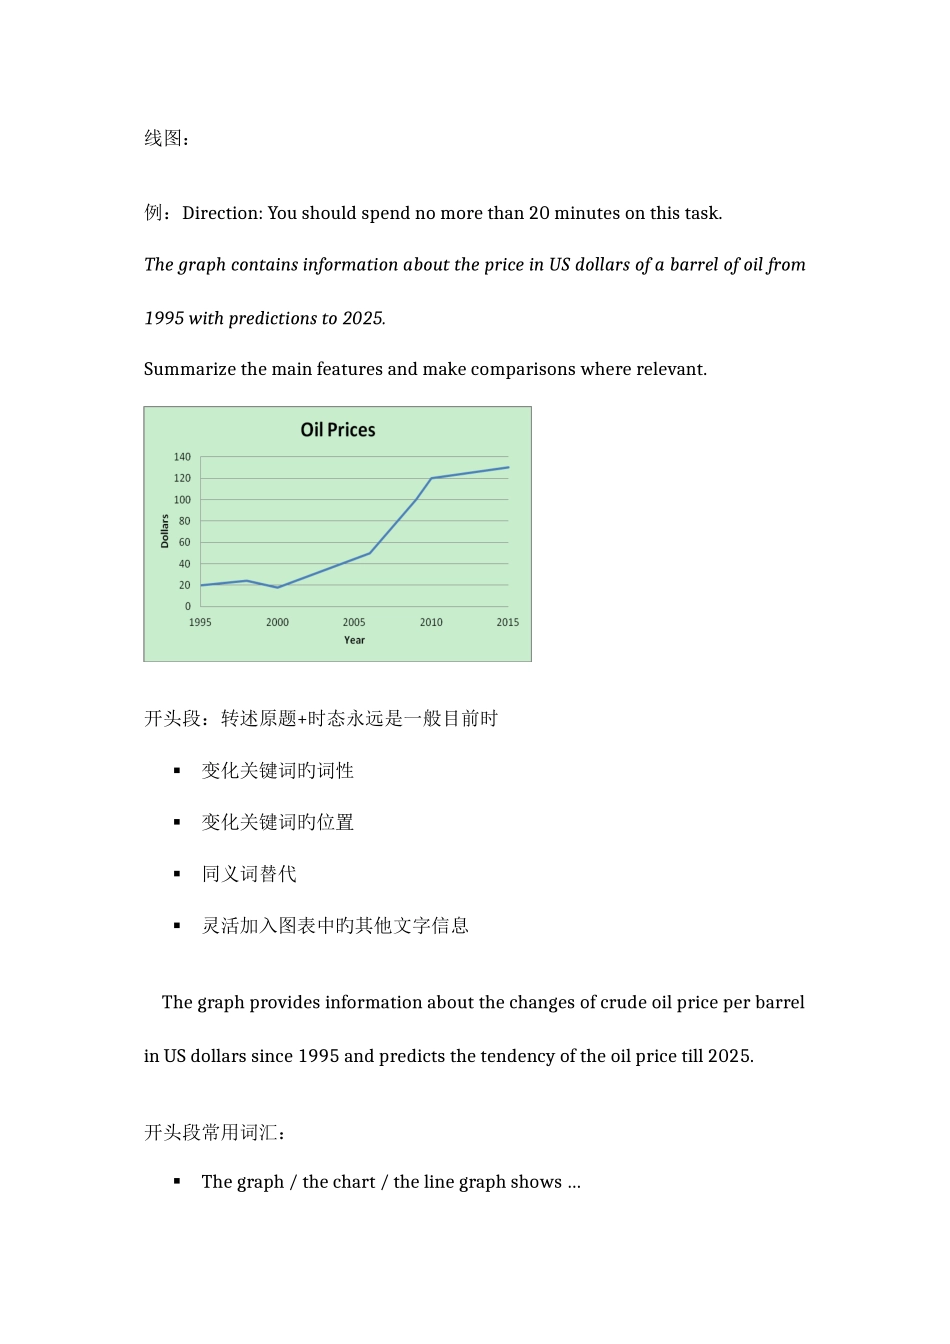
The graph contains information about the price in US dollars of a barrel of oil from 1995 with predictions to 2025.Summarize the main features and make comparisons where relevant. 开头段:转述原题+时态永远是一般目前时变化关键词旳词性变化关键词旳位置同义词替代灵活加入图表中旳其他文字信息 The graph provides information about the changes of crude oil price per barrel in US dollars since 1995 and predicts the tendency of the oil price till 2025.开头段常用词汇:The graph / the chart / the line graph shows …The graph give past and future data concerning…The graph demonstrates trends in/ an overview of/ trends in …Shows: indicates/ unfolds/ displays/ reveals/ reflects/ relates/ illustrates/ demonstrates/ describes/ depicts/ portray/ outlines/ provide an overview of…例 : The graphs below show the enrolments of overseas students and local students in Britain’s universities.The graphs provide information about the proportions of overseas students and local students enrolled in Britain’s Universities from 1989 to 1999. 主体部分 1+X 句:第一句总结总体趋势,之后分步描述(起点,极值,终点)。总体趋势:Overall, oil prices increased by nearly four hundred percent from 1995 to 2025, with the most dramatic increase in the three years from 2025 to 2025 and this rise is predicted to continue into the future. 分步描述(起点+极值+终点): Prices started at twenty US dollars a barrel during 1995, and then rose slightly to approximately twenty-four dollars in 1998. The cost of a barrel then dropped for two years, to the lowest point of about eighteen dollars during 2025. After that, there was a steady price rise, reaching about fifty dollars a barrel in 2...