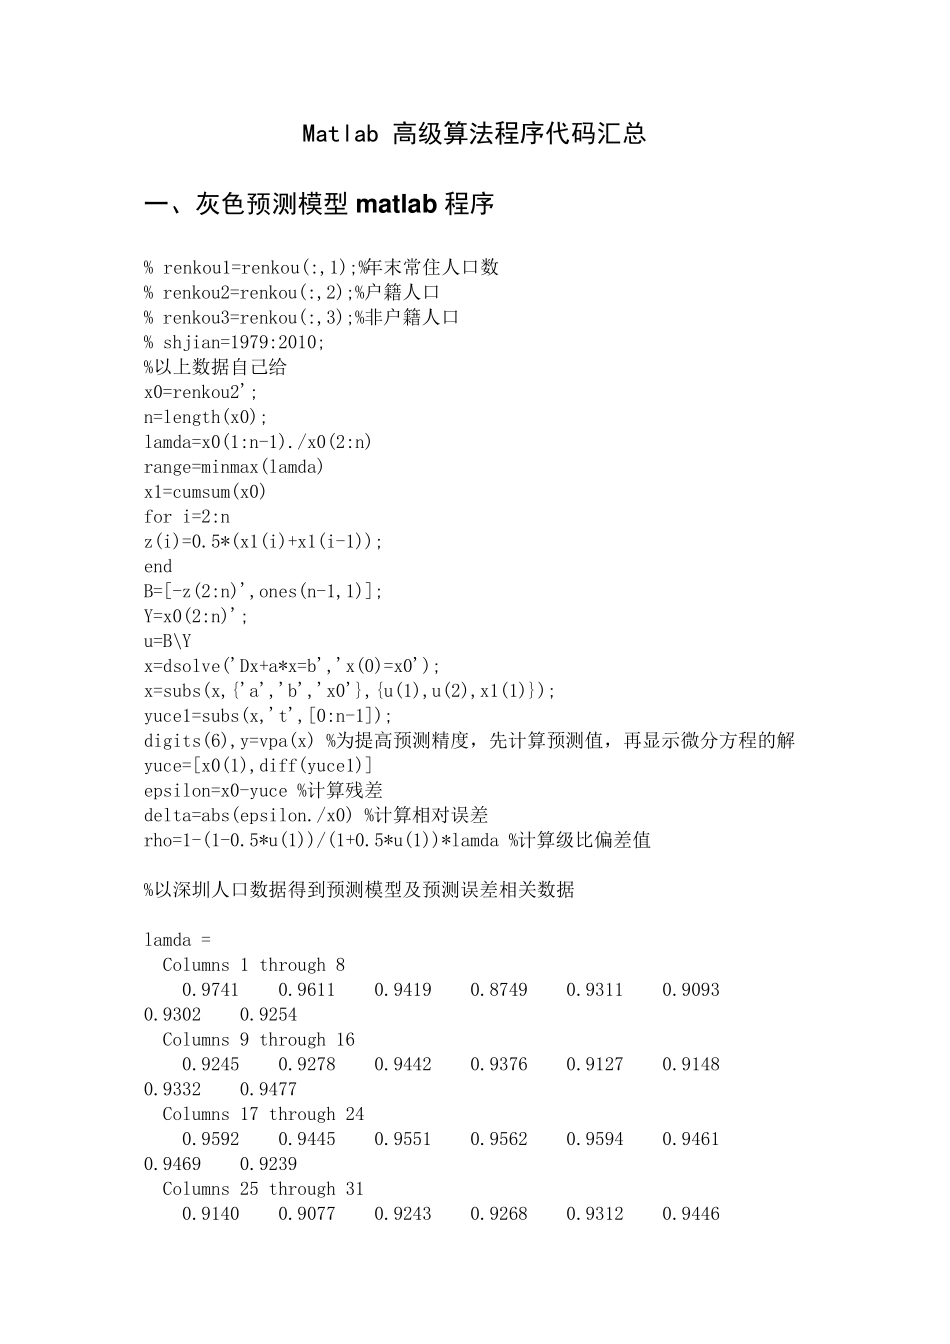
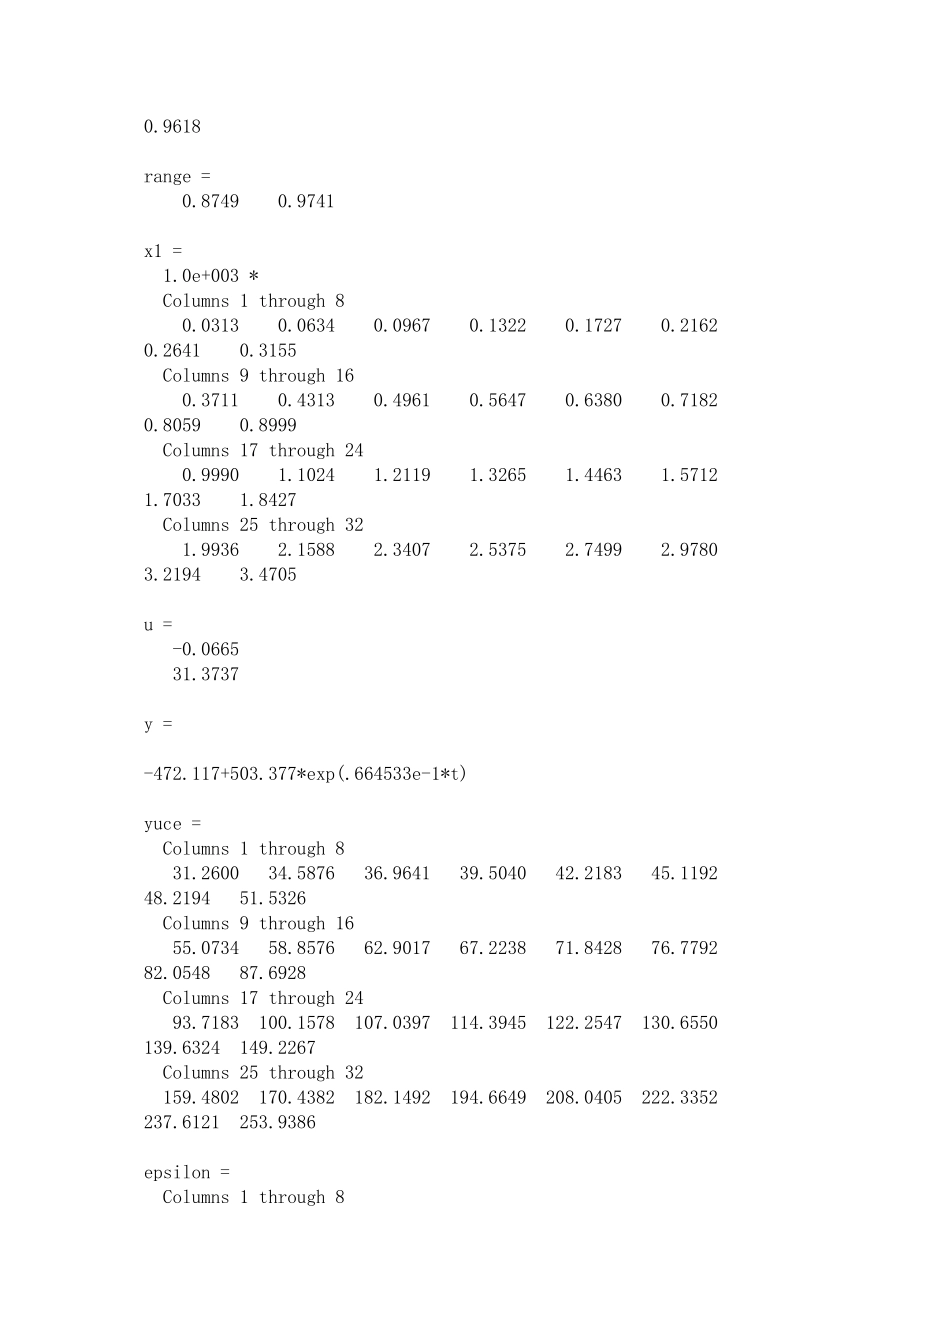
Matlab 高级算法程序代码汇总 一、灰色预测模型 matlab 程序 % renkou1=renkou(:,1);%年末常住人口数 % renkou2=renkou(:,2);%户籍人口 % renkou3=renkou(:,3);%非户籍人口 % shjian=1979:2010; %以上数据自己给 x0=renkou2'; n=length(x0); lamda=x0(1:n-1)./x0(2:n) range=minmax(lamda) x1=cumsum(x0) for i=2:n z(i)=0.
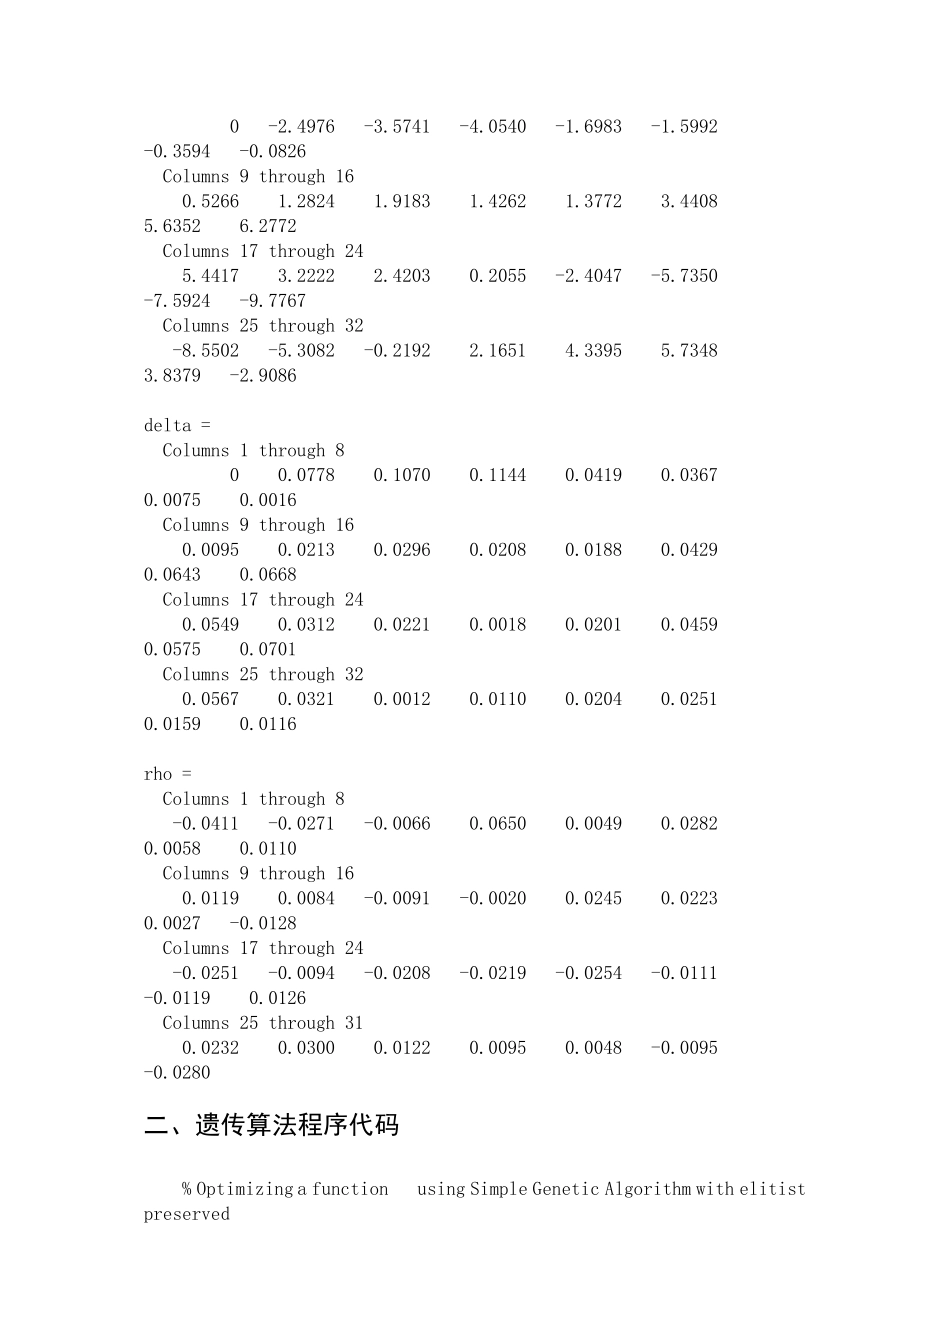
5*(x1(i)+x1(i-1)); end B=[-z(2:n)',ones(n-1,1)]; Y=x0(2:n)'; u=B\Y x=dsolve('Dx+a*x=b','x(0)=x0'); x=subs(x,{'a','b','x0'},{u(1),u(2),x1(1)}); yuce1=subs(x,'t',[0:n-1]); digits(6),y=vpa(x) %为提高预测精度,先计算预测值,再显示微分方程的解 yuce=[x0(1),diff(yuce1)] epsilon=x0-yuce %计算残差 delta=abs(epsilon./x0) %计算相对误差 rho=1-(1-0.5*u(1))/(1+0.5*u(1))*lamda %计算级比偏差值 %以深圳人口数据得到预测模型及预测误差相关数据 lamda = Columns 1 through 8 0.9741 0.9611 0.9419 0.8749 0.9311 0.9093 0.9302 0.9254 Columns 9 through 16 0.9245 0.9278 0.9442 0.9376 0.9127 0.9148 0.9332 0.9477 Columns 17 through 24 0.9592 0.9445 0.9551 0.9562 0.9594 0.9461 0.9469 0.9239 Columns 25 through 31 0.9140 0.9077 0.9243 0.9268 0.9312 0.9446 0.9618 range = 0.8749 0.9741 x1 = 1.0e+003 * Columns 1 through 8 0.0313 0.0634 0.0967 0.1322 0.1727 0.2162 0.2641 0.3155 Columns 9 through 16 0.3711 0.4313 0.4961 0.5647 0.6380 0.7182 0.8059 0.8999 Columns 17 through 24 0.9990 1.1024 1.2119 1.3265 1.4463 1.5712 1.7033 1.8427 Columns 25 through 32 1.9936 2.1588 2.3407 2.5375 2.7499 2.9780 3.2194 3.4705 u = -0.0665 31.3737 y = -472.117+503.377*exp(.664533e-1*t) yuce = Columns 1 through 8 31.2600 34.5876 36.9641 39.5040 42.2183 45.1192 48.2194 51.5326 Columns 9 through 16 55.0734 58.8576 62.9017 67.2238 71.8428 76.7792 82.0548 87.6928 Columns 17 through 24 93.7183 100.1578 107.0397 114.3945 122.2547 130.6550 139.6324 149.2267 Columns 25 through 32 159.4802 170.4382 182.1492 194.6649 208.0405 222.3352 237.6121 ...