四级作文 一、 图表分析型模板 (1)As is clearly shown in the table/ figure/ graph/ chart, _________ between ______________ and __________. (2) Especially, ______________. (3) There are three reasons for ____________. (4) To begin with, ______________. (5) In addition / Moreover, ______________. (6) For example, __________. (7) Last but not least _______________. (8) In short, ________________. (9) As far as I am concerned/ For my part/ As for me, ______________. (10) On one hand, ________________. (11) On the other hand, _____________. (12) In brief, ________________. 
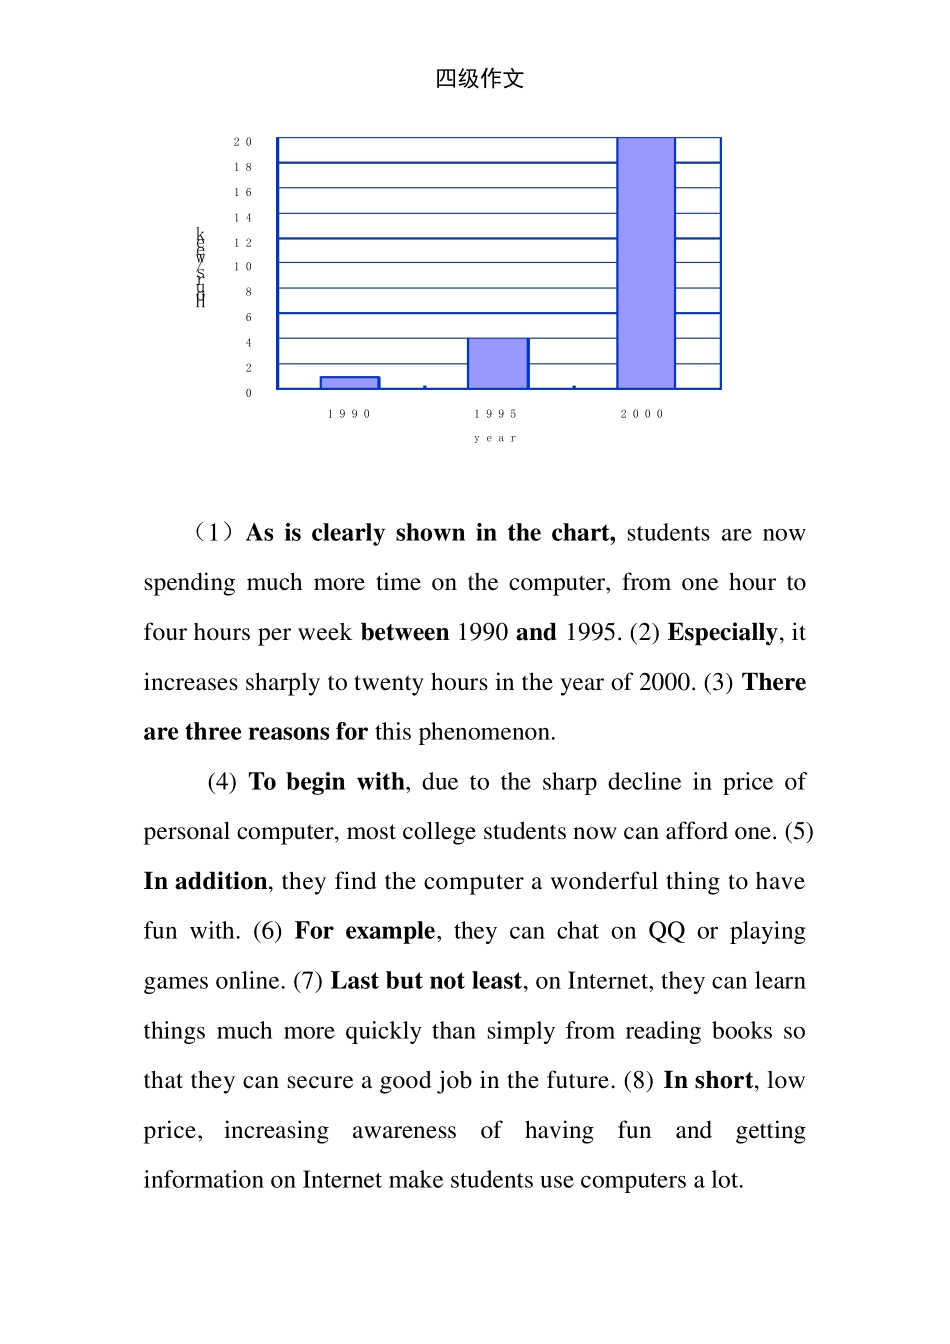
填充内容: (1)图表总体描述+年代 (2)指出突出的数据变化 (3)具体表示急剧上升、下降或特殊现象的词 (4)叙述第一个原因 (5)叙述第二个原因 (6)具体例证 (7)叙述最后一个原因 (8)总结上文 (9)作者自己的观点 (10)理由一 (11)理由二 (12)总结全文 范文欣赏 四级作文 (1)As is clearly shown in the chart, students are now spending much more time on the computer, from one hour to four hours per week between 1990 and 1995. (2) Especially, it increases sharply to twenty hours in the year of 2000. (3) There are three reasons for this phenomenon. (4) To begin with, due to the sharp decline in price of personal computer, most college students now can afford one. (5) In addition, they find the computer a wonderful thing to have fun with. (6) For example, they can chat on QQ or playing games online. (7) Last but not least, on Internet, they can learn things much more quickly than simply from reading books so that they can secure a good job in the future. (8) In short, low price, increasing awareness of having fun and getting information on Internet make students use computers a lot. 024681 01 21 41 61 82 01 9 9 01 9 9 52 0 0 0y e a rHours/week 四...