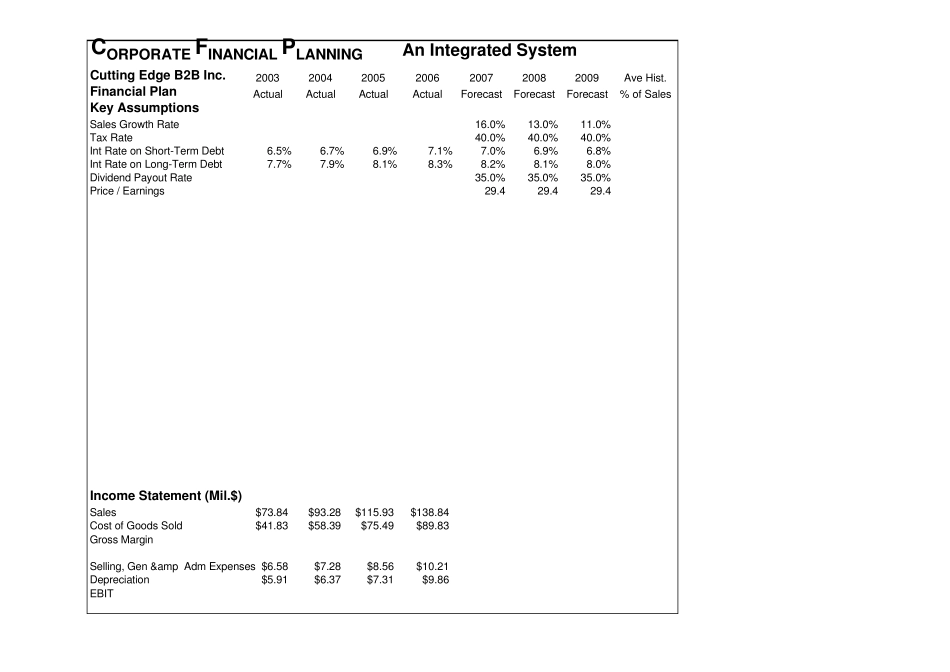
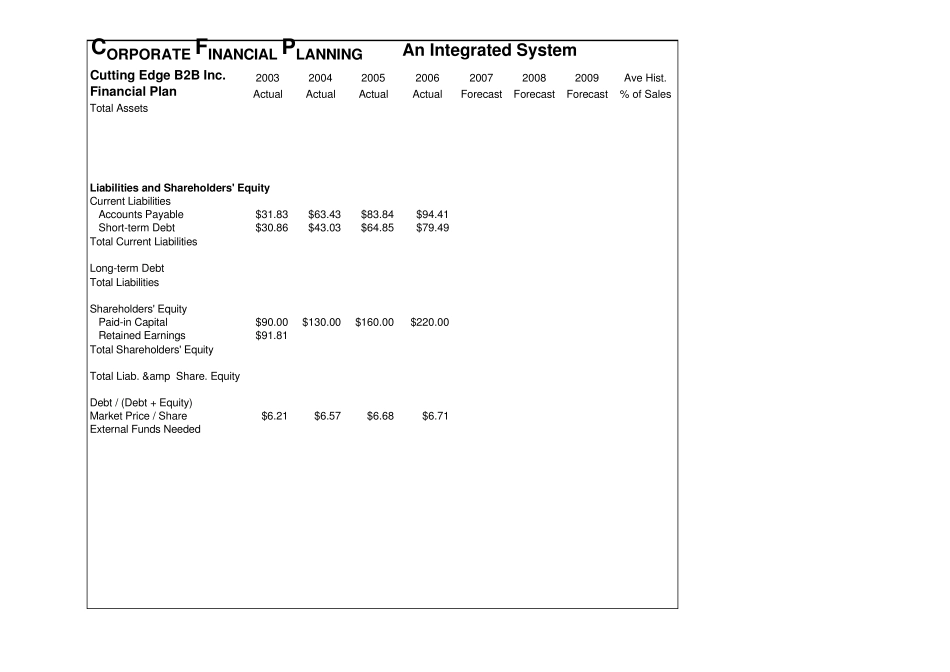
CORPORATE FINANCIAL PLANNINGAn Integrated SystemCutting Edge B2B Inc
2003200420052006200720082009Ave Hist
Financial PlanActualActualActualActualForecastForecastForecast% of SalesKey AssumptionsSales Growth Rate16
0%Tax Rate40
0%Int Rate on Short-Term Debt6
8%Int Rate on Long-Term Debt7
0%Dividend Payout Rate35
0%Price / Earnings29
4Income Statement (Mil
$)Sales$73
28$115
93$138
84Cost of Goods Sold$41
83Gross MarginSelling, Gen & Adm Expenses $6
21Depreciation$5
86EBITCORPORATE FINANCIAL PLANNINGAn Integrated SystemCutting Edge B2B Inc
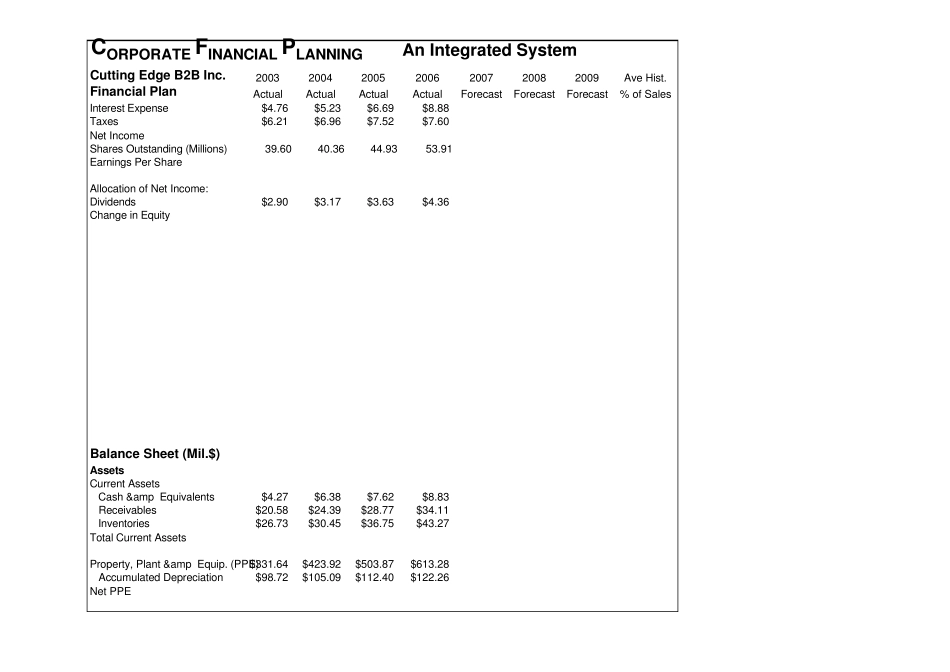
2003200420052006200720082009Ave Hist
Financial PlanActualActualActualActualForecastForecastForecast% of SalesInterest