雅思写作小作文线形图表题附范文雅思写作 – LINE GRAPHWRITING TASK 1 (Test 2, Cambridge IELTS 7)You should spend about 20 minutes on this task
This graph below shows the consumption of fish and some different kinds of meat in a European country between 1979 and
Summarise the information by selecting and reporting the main features, and make comparisons where relevant
Write at least 150 words
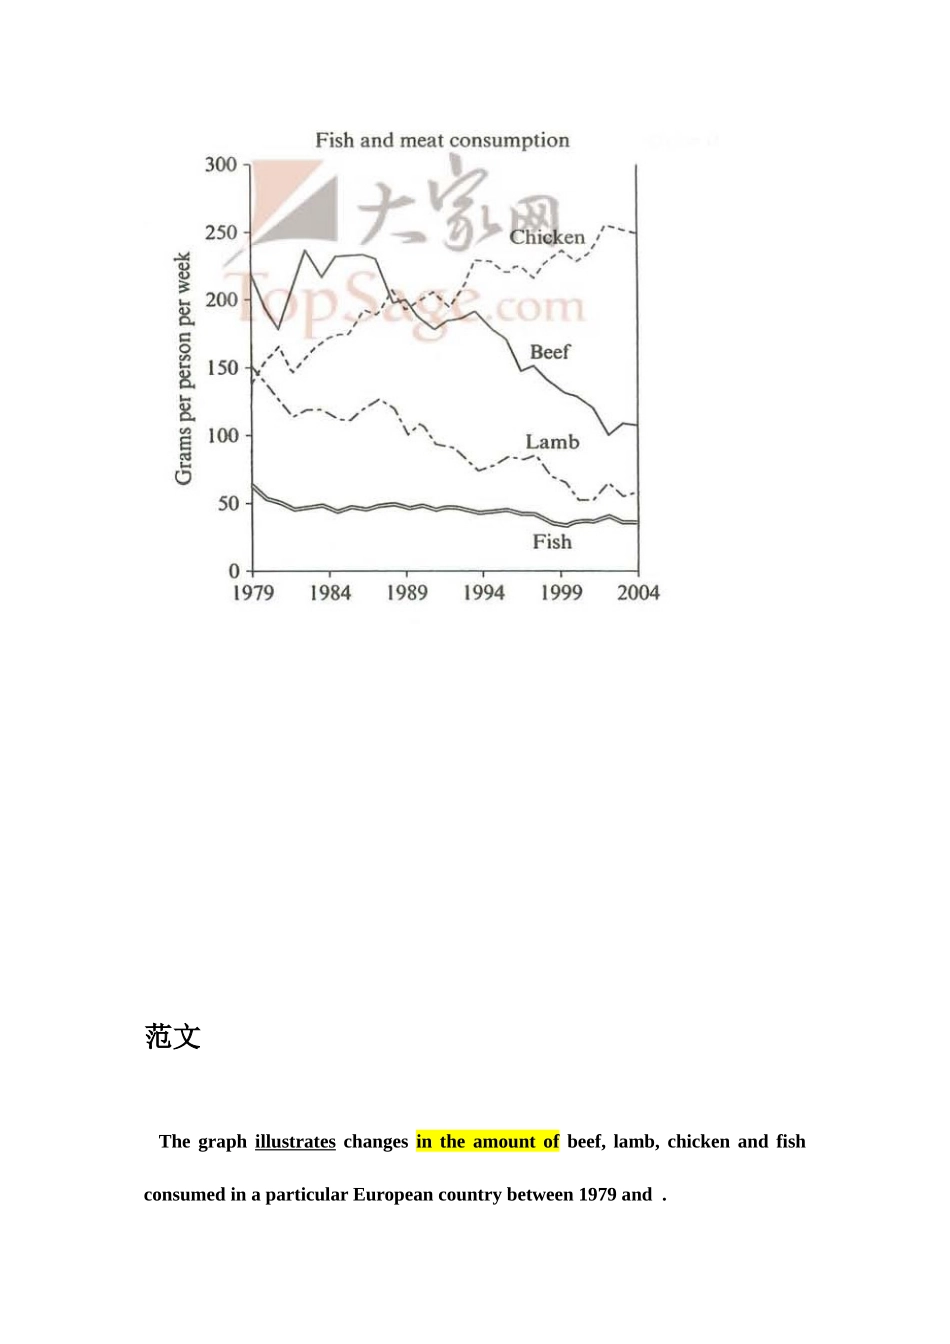
范文 The graph illustrates changes in the amount of beef, lamb, chicken and fish consumed in a particular European country between 1979 and
In 1979, beef was by far the most popular of these foods, with about 225 grams consumed per person per week
Lamb and chicken were eaten in similar quantities (around 150 grams), while much less fish was consumed (just over 50 grams)
However, during this 25-year period the consumpti