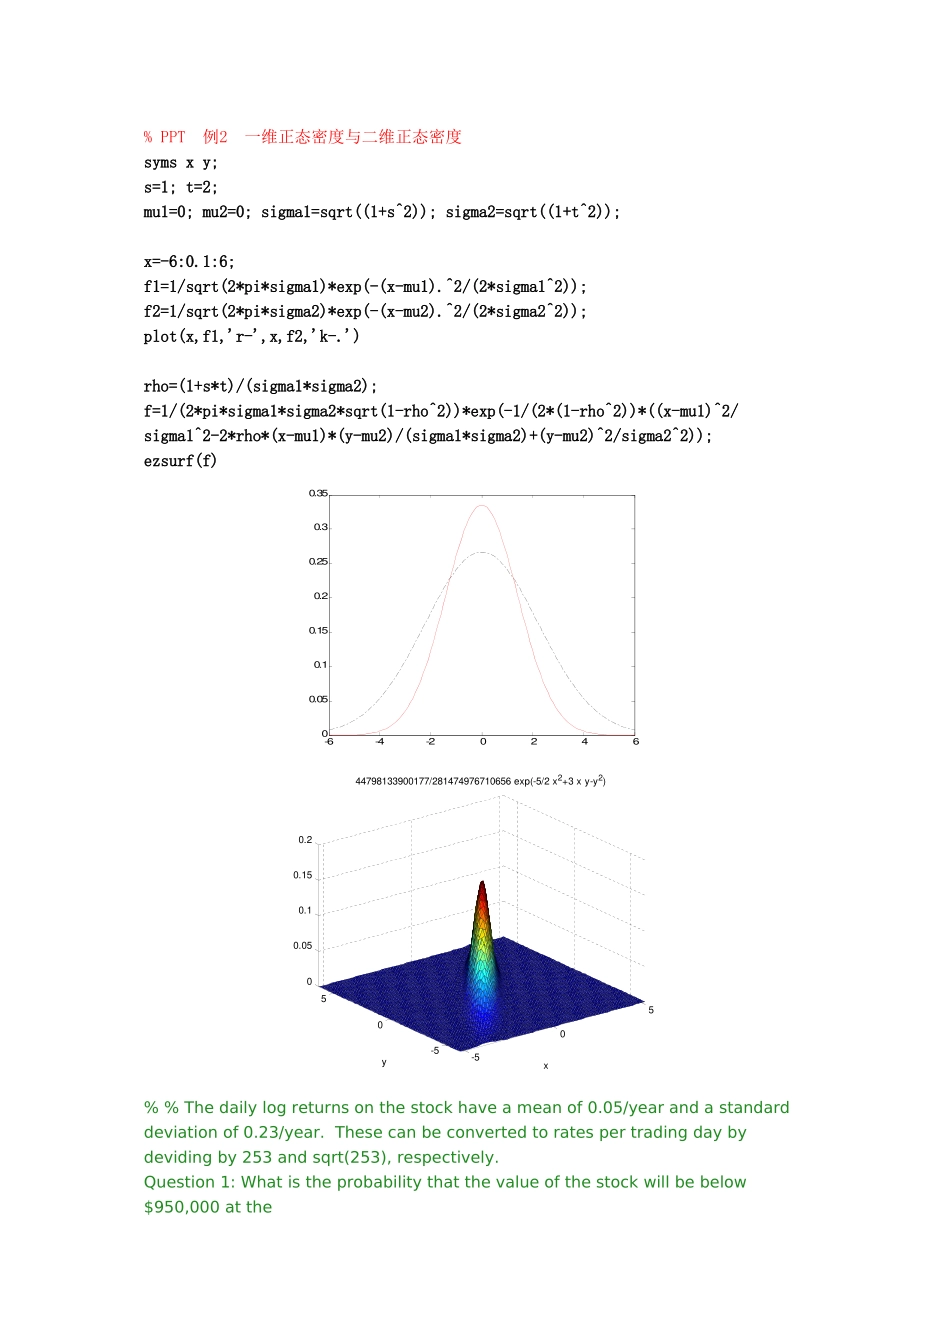
%PPT例2一维正态密度与二维正态密度symsxy;s=1;t=2;mu1=0;mu2=0;sigma1=sqrt((1+s^2));sigma2=sqrt((1+t^2));x=-6:0
1:6;f1=1/sqrt(2*pi*sigma1)*exp(-(x-mu1)
^2/(2*sigma1^2));f2=1/sqrt(2*pi*sigma2)*exp(-(x-mu2)
^2/(2*sigma2^2));plot(x,f1,'r-',x,f2,'k-
')rho=(1+s*t)/(sigma1*sigma2);f=1/(2*pi*sigma1*sigma2*sqrt(1-rho^2))*exp(-1/(2*(1-rho^2))*((x-mu1)^2/sigma1^2-2*rho*(x-mu1)*(y-mu2)/(sigma1*sigma2)+(y-mu2)^2/sigma2^2));ezsurf(f)-6-4-2024600
35-505-50500
2x44798133900177/281474976710656exp(-5/2x2+3xy-y2)y%%Thedailylogreturnsonthestockhaveameanof0
05/yearandastandarddeviationof0
23/year
Thesecanbeconvertedtoratespertradingdaybydevidingby253andsqrt(253),respectively
Question1:Whatistheprobabilitythatthevalueofthestockwillbebelow$950,000attheclosedayofatleastoneofthe