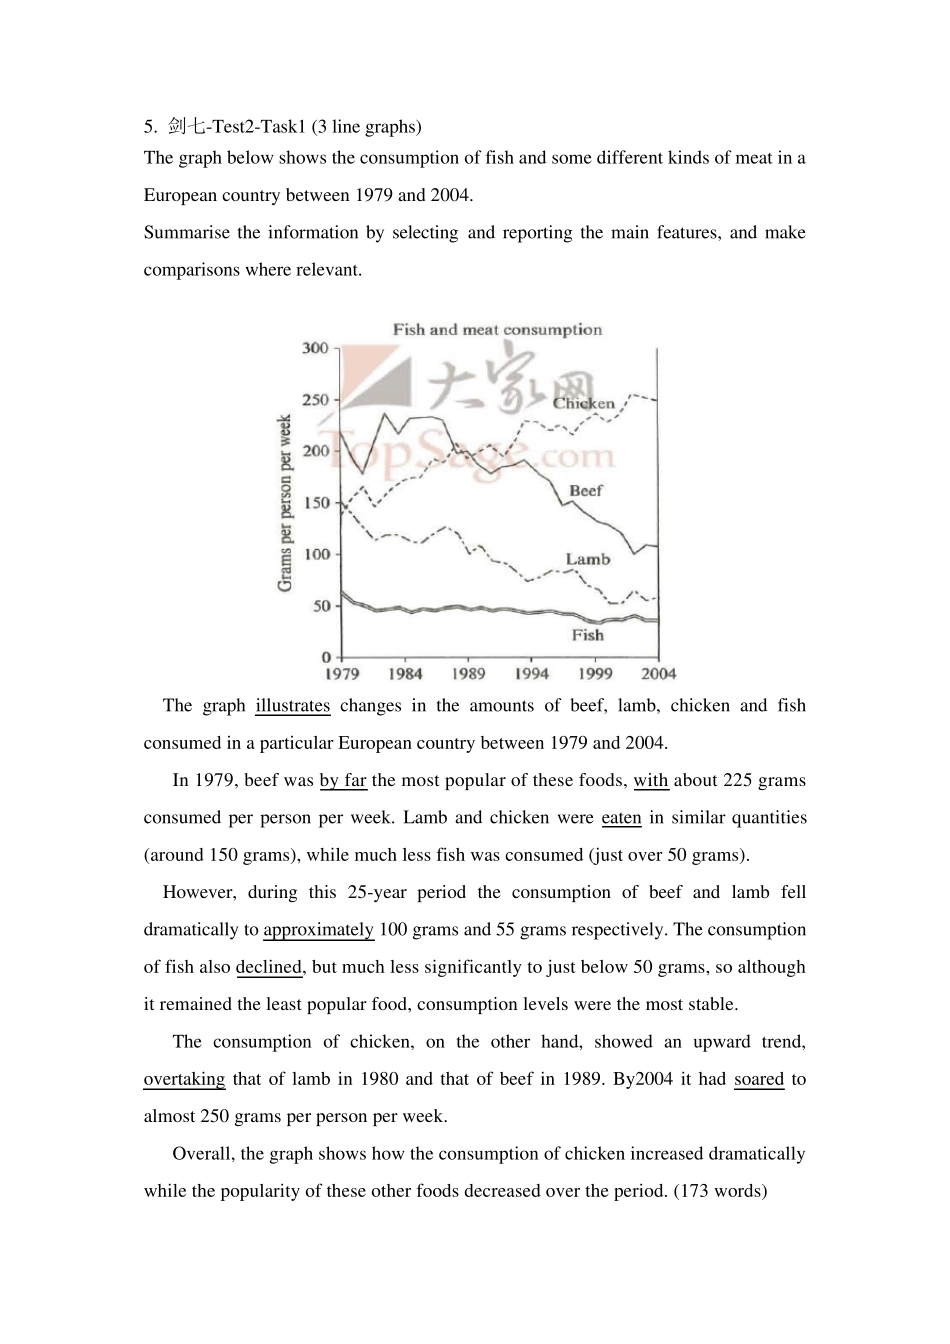
5. 剑七-Test2-Task1 (3 line graphs) The graph below shows the consumption of fish and some different kinds of meat in a European country between 1979 and 2004. Summarise the information by selecting and reporting the main features, and make comparisons where relevant. The graph illustrates changes in the amounts of beef, lamb, chicken and fish consumed in a particular European country between 1979 and 2004. In 1979, beef was by far the most popular of these foods, with about 225 grams consumed per person per week. Lamb and chicken were eaten in similar quantities (around 150 grams), while much less fish was consumed (just over 50 grams). However, during this 25-year period the consumption of beef and lamb fell dramatically to approximately 100 grams and 55 grams respectively. The consumption of fish also declined, but much less significantly to just below 50 grams, so although it remained the least popular food, consumption levels were the most stable. The consumption of chicken, on the other hand, showed an upward trend, overtaking that of lamb in 1980 and that of beef in 1989. By2004 it had soared to almost 250 grams per person per week. Overall, the graph shows how the consumption of chicken increased dramatically while the popularity of these other foods decreased over the period. (173 words) 6. 剑七-Test4-Task1 (4 Pie charts) The charts compare the sources of electricity in Australia and France in the years 1980 and 2000. Between these years, electricity production almost doubled, rising from 100 units to 170 in Australia, and from 90 to 180 units in France. In 1980, Australia used coal the main the electricity source (50 units) and the remainder was produced from natural gas, hydr...