Chapter 34 Problems and Applications 1. a. When the Fed’s bond traders buy bonds in open-market operations, the money-supply curve shifts to the right from MS 1 to MS 2, as shown in Figure 1. The result is a decline in the interest rate. Figu re 1 Figu re 2 b. When an increase in credit card availability reduces the cash people hold, the money-demand curve shifts to the left from MD 1 to MD 2, as shown in Figure 2. The result is a decline in the interest rate. c. When the Federal Reserve reduces reserve requirements, the money supply increases, so the money-supply curve shifts to the right from MS 1 to MS 2, as shown in Figure 1. The result is a decline in the interest rate. d. 
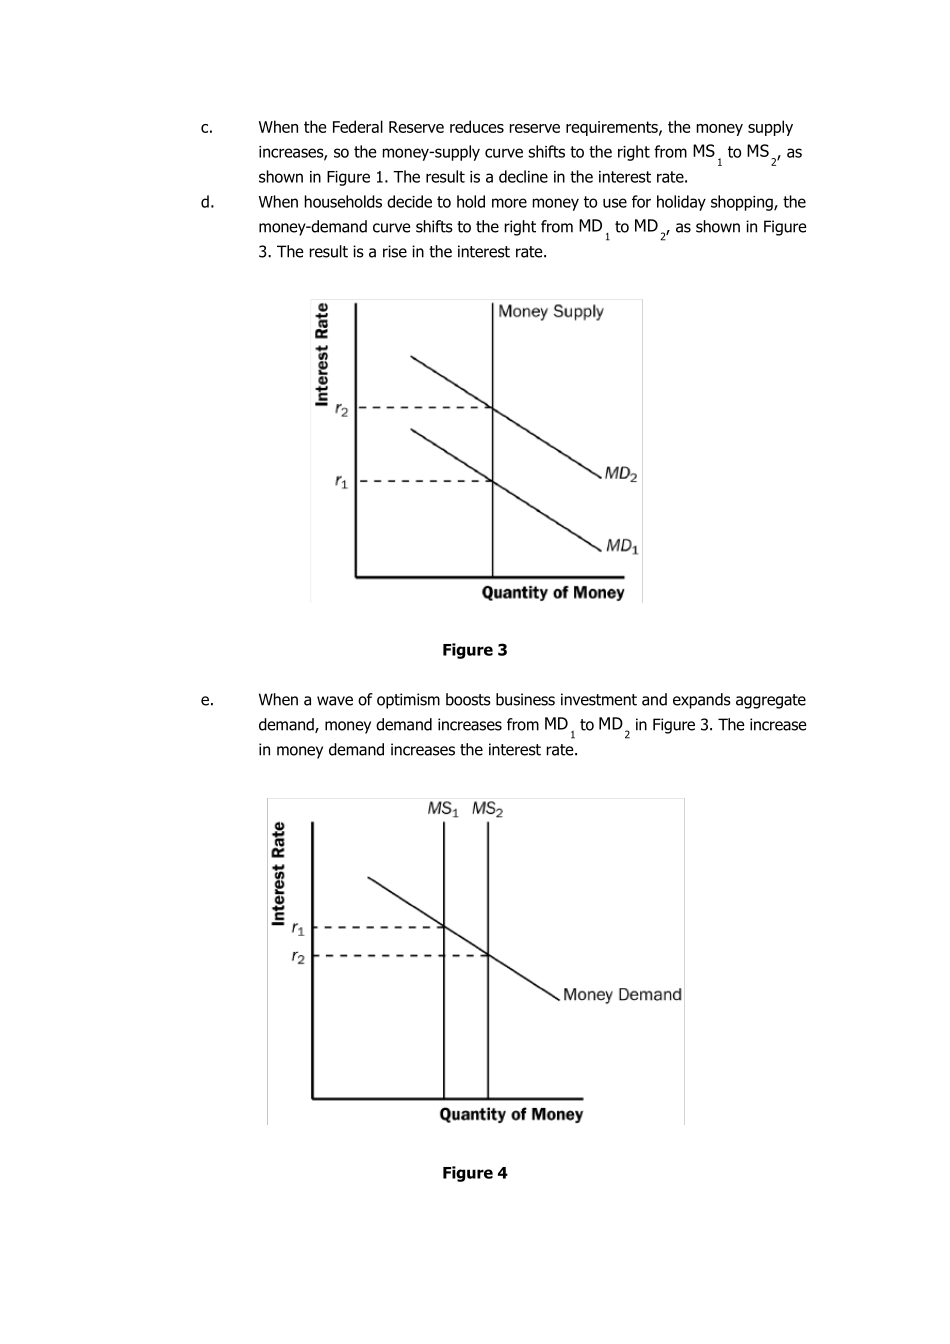
When households decide to hold more money to use for holiday shopping, the money-demand curve shifts to the right from MD 1 to MD 2, as shown in Figure 3. The result is a rise in the interest rate. Figu re 3 e. When a wave of optimism boosts business investment and expands aggregate demand, money demand increases from MD 1 to MD 2 in Figure 3. The increase in money demand increases the interest rate. Figu re 4 2. a. The increase in the money supply will cause the equilibrium interest rate to decline, as shown in Figure 4. Households will increase spending and will invest in more new housing. Firms too will increase investment spending. This will cause the aggregate demand curve to shift to the right as shown in Figure 5. Figu re 5 b. As shown in Figure 5, the increase in aggregate demand will cause an increase in both output and the price level in the short run. c. When the economy makes the transition from its short-run equilibrium to its long-run equilibrium, short-run aggregate su...