计 量 经 济 学 实 验 报 告 实验目的:掌握自相关问题的检验以及相关的Eviews 的操作方法。实验内容:消费总量的多少主要有GDP 决定。为了考察GDP 对消费总额的影响,可使用如下模型:Yi=10 iX ;其中,X 表示GDP,Y 表示消费总量。下表列出了中国1990-2000 的GDP 的X 与消费总额Y 的统计数据。 年份 GDP(X ) 消费总额(Y ) 年份 GDP(X ) 消费总额(Y ) 1990 18319.5 11365.2 1998 79003.3 46405.9 1991 21280.4 13145.9 1999 82673.2 49722.8 1992 25863.7 15952.1 2000 89112.5 54617.2 1993 34500.7 20182.1 2001 98592.9 58927.4 1994 46690.7 26796 2002 107897.6 62798.5 1995 58510.5 33635 2003 121730.3 67493.5 1996 68330.4 40003.9 2004 142394.2 75439.7 1997 74894.2 43579.
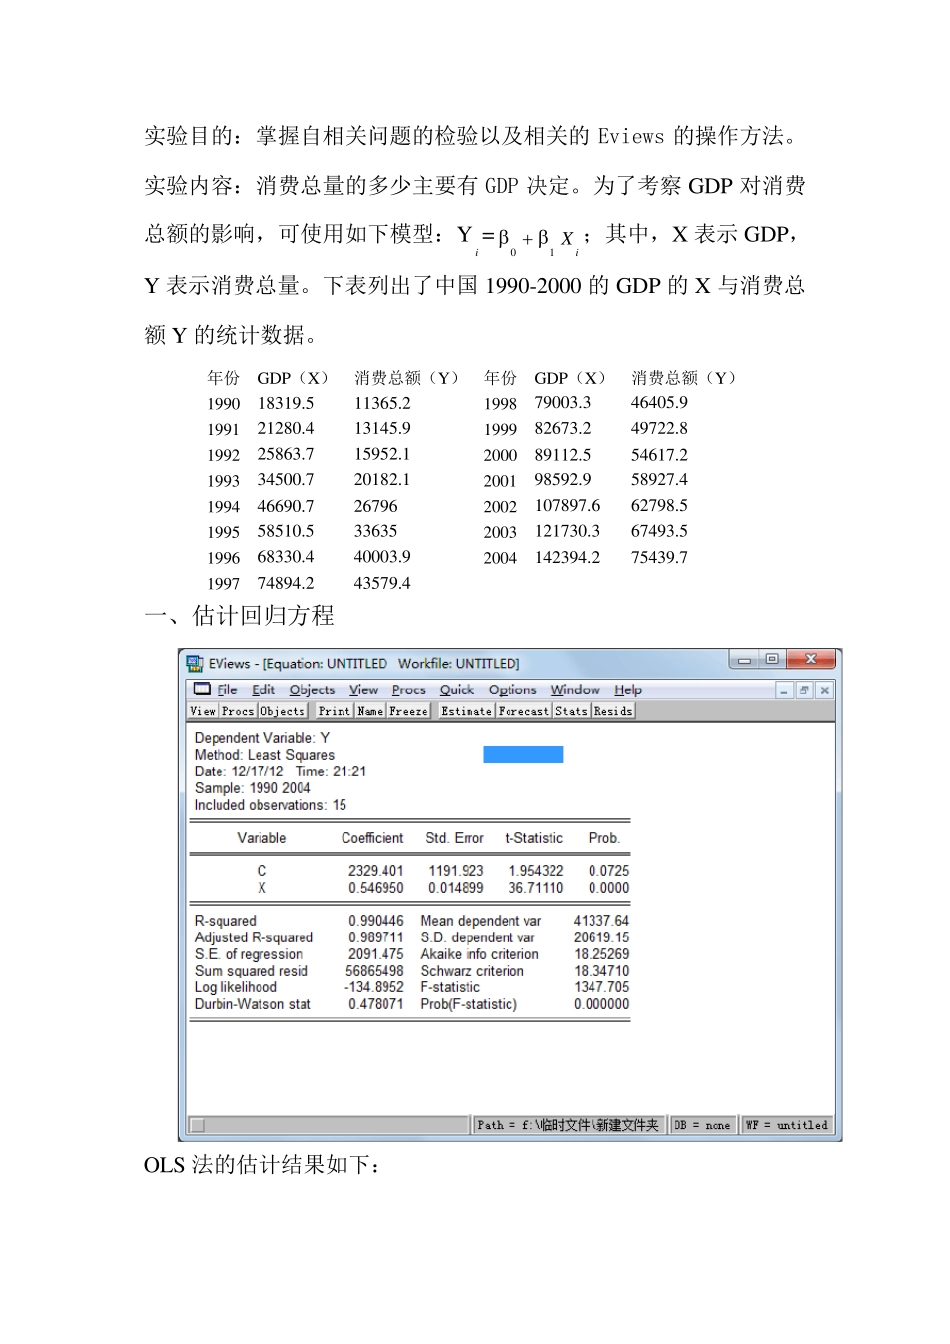
4 一、估计回归方程 OLS 法的估计结果如下: Y=2329.401+0.546950X (1.954322)(36.71110) R 2 =0.990446,R 2 =0.989711,SE=2091.475,D.W.=0.478071。 
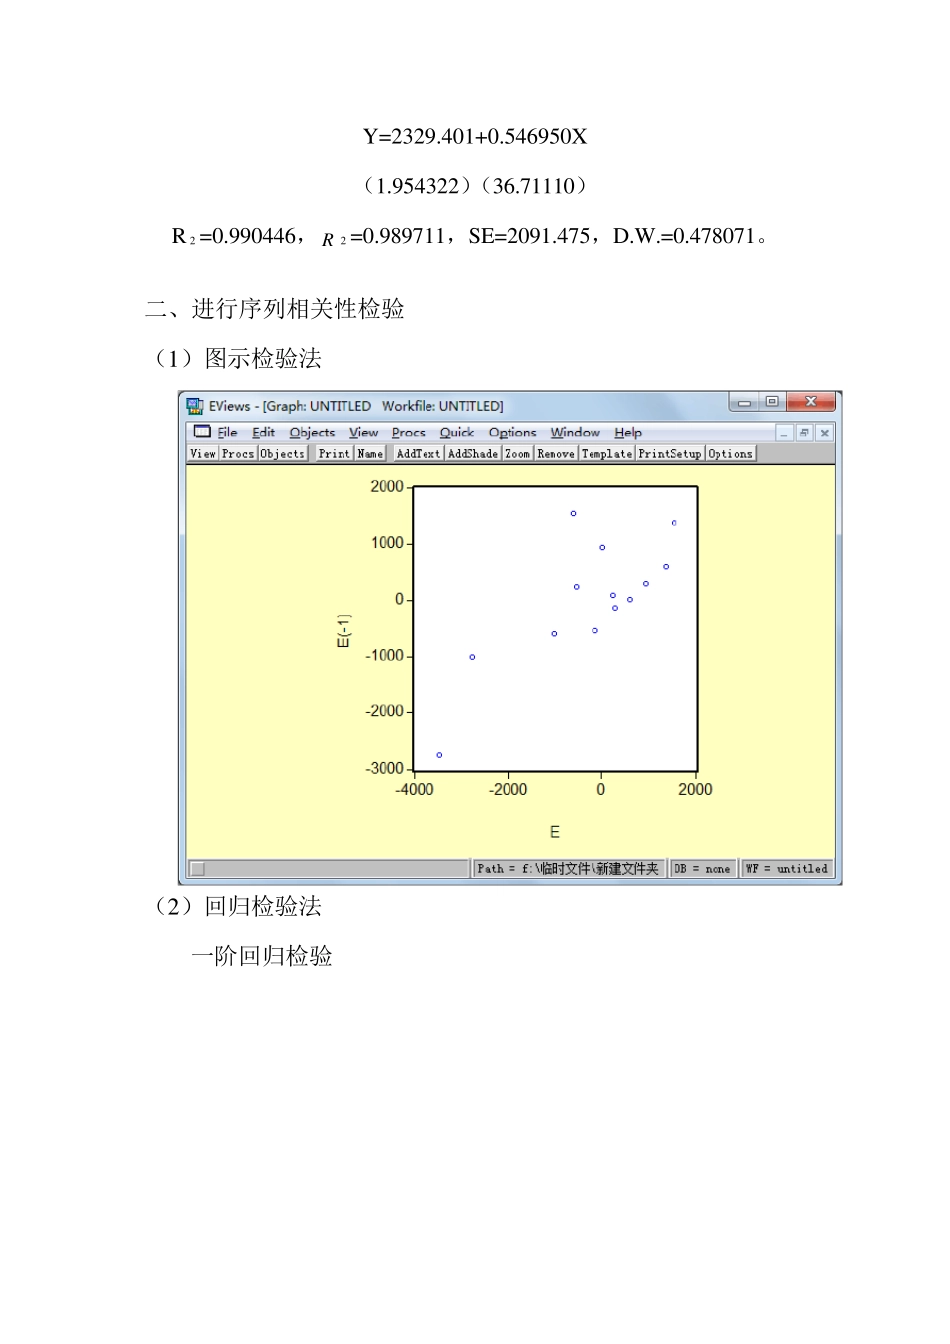
二、进行序列相关性检验 (1)图示检验法 (2)回归检验法 一阶回归检验 二阶回归检验 te =1.144406e1-t -0.343796e2-t +εt 3)拉格朗日乘数(LM)检验法 Breusch-Godfrey Serial Correlation LM Test: F-statistic 29.41781 Probability 0.000038 Obs*R-squared 12.63731 Probability 0.001802 Test Equation: Dependent Variable: RESID Method: Least Squares Date: 12/17/12 Time: 21:51 Variable Coefficient Std. Error t-Statistic Prob. C 37.31393 644.3315 0.057911 0.9549 X -0.002008 0.009377 -0.214144 0.8344 RESID(-1) 1.744086 0.234326 7.442998 0.0000 RESID(-2) -1.088243 0.315853 -3.445408 0.0055 R-squared 0.842487 Mean dependent var 4.37E-12 Adjusted R-squared 0.799529 S.D. dependent var 2015.396 S.E. of regression 902.3726 Akaike info criterion 16.67111 Sum squared resid 8957040. Schwarz criterion 16.85992 Log likelihood -121.0333 F-statistic 19.61188 Durbin-Watson stat 2.360720 Prob(F-statistic) 0.000101 C=37.31393 x =-0.002008 RESID(-1)=1.744086 RESID(-2)= -1.088243 三、序列相关的补救 Dependent Variable: DY...