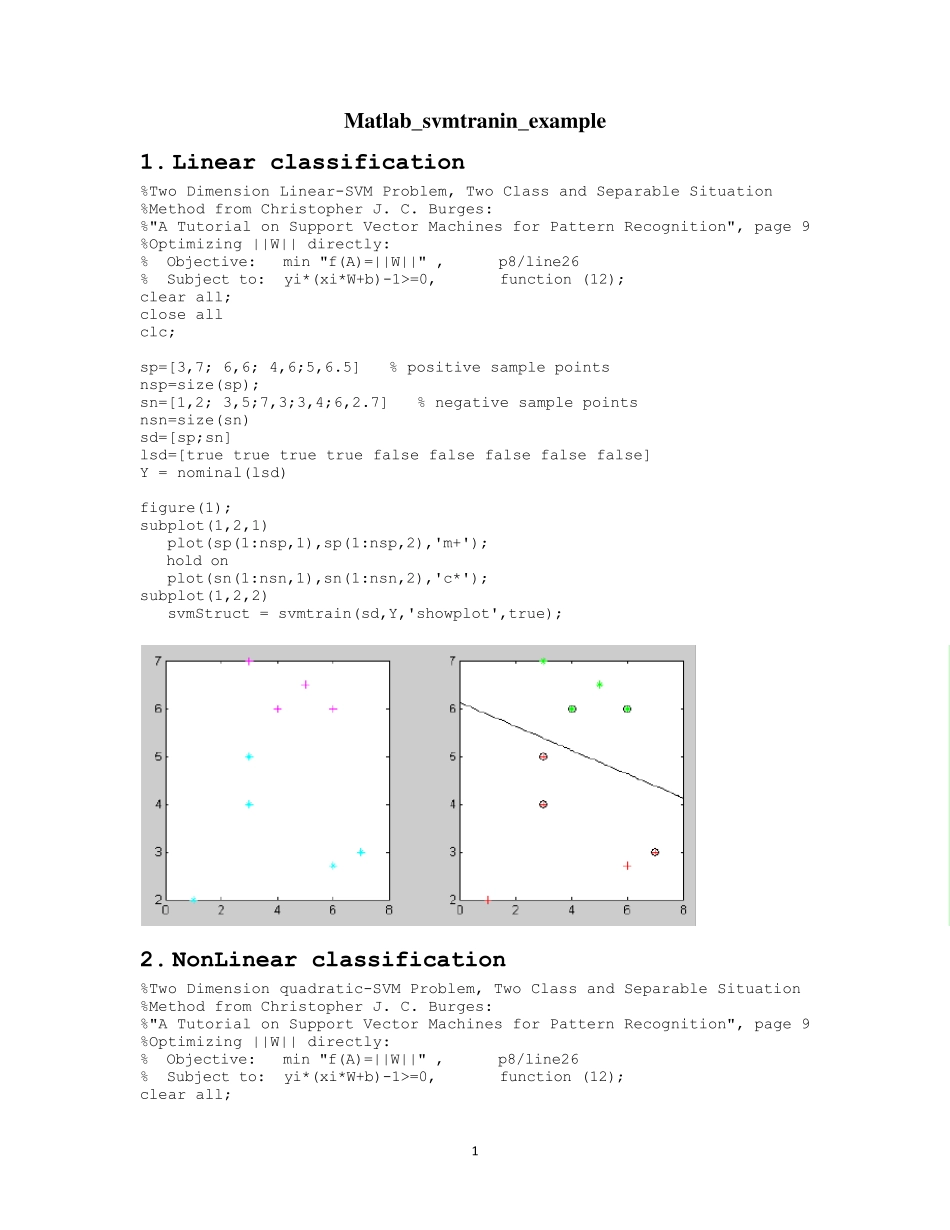
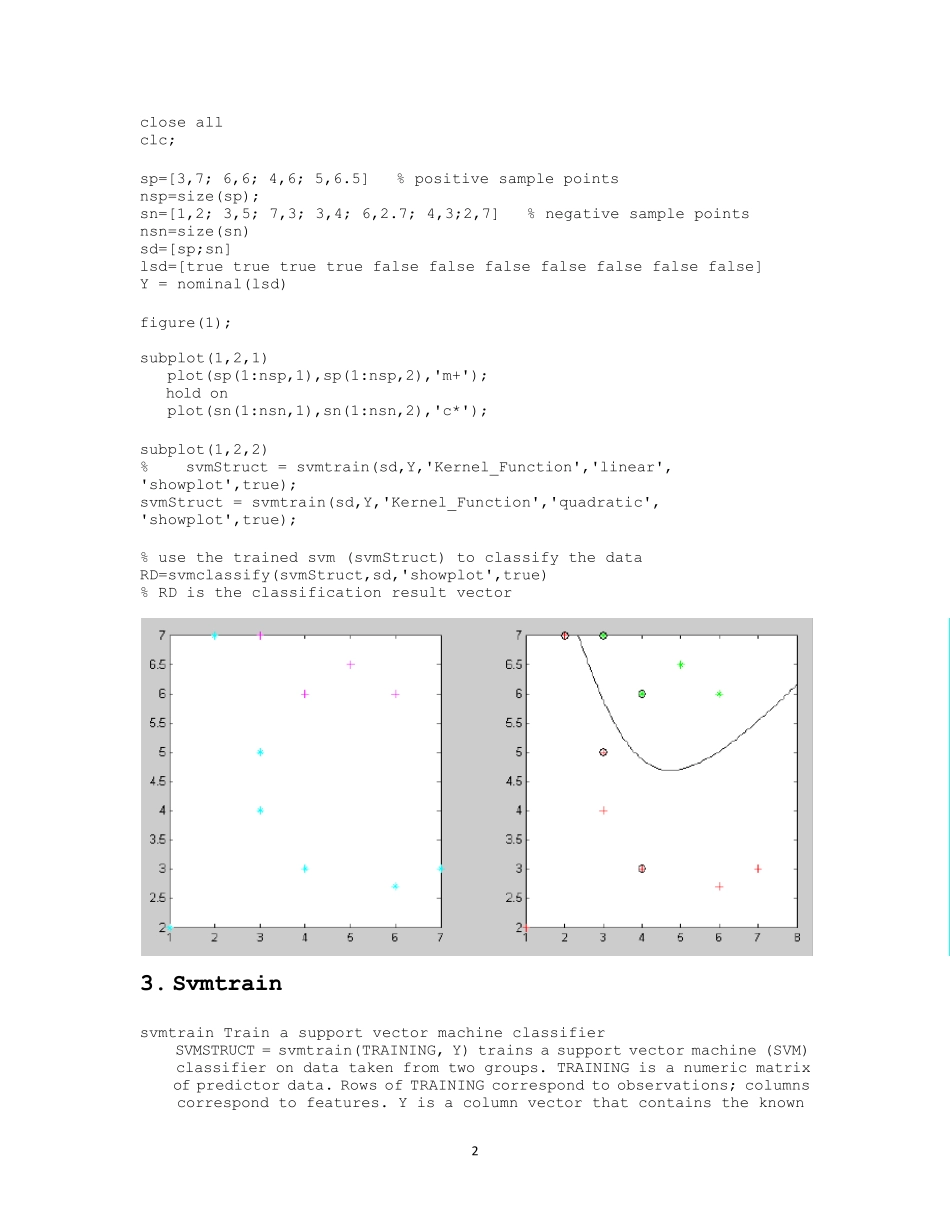
1 Matlab_sv mtranin_ex ample 1. Linear classification %Two Dimension Linear-SVM Problem, Two Class and Separable Situation %Method from Christopher J. C. Burges: %"A Tutorial on Support Vector Machines for Pattern Recognition", page 9 %Optimizing ||W|| directly: % Objective: min "f(A)=||W||" , p8/line26 % Subject to: yi*(xi*W+b)-1>=0, function (12); clear all; close all clc; sp=[3,7; 6,6; 4,6;5,6.5] % positive sample points nsp=size(sp); sn=[1,2; 3,5;7,3;3,4;6,2.7] % negative sample points nsn=size(sn) sd=[sp;sn] lsd=[true true true true false false false false false] Y = nominal(lsd) figure(1); subplot(1,2,1) plot(sp(1:nsp,1),sp(1:nsp,2),'m+'); hold on plot(sn(1:nsn,1),sn(1:nsn,2),'c*'); subplot(1,2,2) svmStruct = svmtrain(sd,Y,'showplot',true); 2. NonLinear classification %Two Dimension quadratic-SVM Problem, Two Class and Separable Situation %Method from Christopher J. C. Burges: %"A Tutorial on Support Vector Machines for Pattern Recognition", page 9 %Optimizing ||W|| directly: % Objective: min "f(A)=||W||" , p8/line26 % Subject to: yi*(xi*W+b)-1>=0, function (12); clear all; 2 close all clc; sp=[3,7; 6,6; 4,6; 5,6.5] % positive sample points nsp=size(sp); sn=[1,2; 3,5; 7,3; 3,4; 6,2.7; 4,3;2,7] % negative sample points nsn=size(sn) sd=[sp;sn] lsd=[true true true true false false false false false false false] Y = nominal(lsd) figure(1); subplot(1,2,1) plot(sp(1:nsp,1),sp(1:nsp,2),'m+'); hold on plot(sn(1:nsn,1),sn(1:nsn,2),'c*'); subplot(1,2,2) % svmStruct = svmtrain(sd,Y,'Kernel_Function','linear', 'showplot',true); svmStruct = svmtrain(sd,Y,'Kernel_Function','quadratic', 'showplot',true); % use the trained svm (svmStruct) to classify the data RD=svmclassify(svmStruct,sd,'showplot',true) % RD is the classification result vector 3. Svmtrain svmtrain...