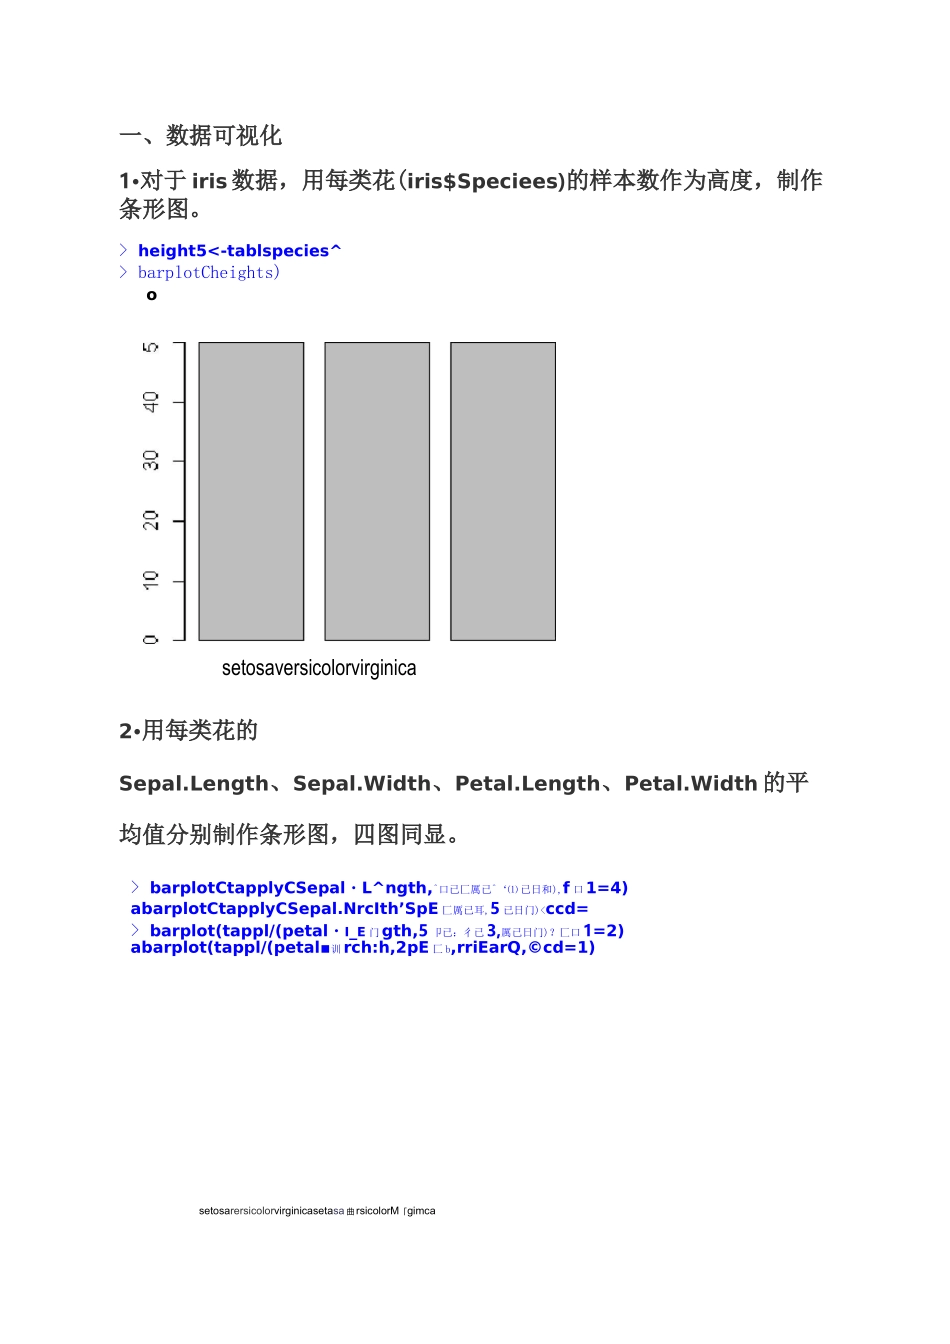
setosarersicolorvirginicasetasa 曲 rsicolorM「gimca一、数据可视化1•对于 iris 数据,用每类花(iris$Speciees)的样本数作为高度,制作条形图
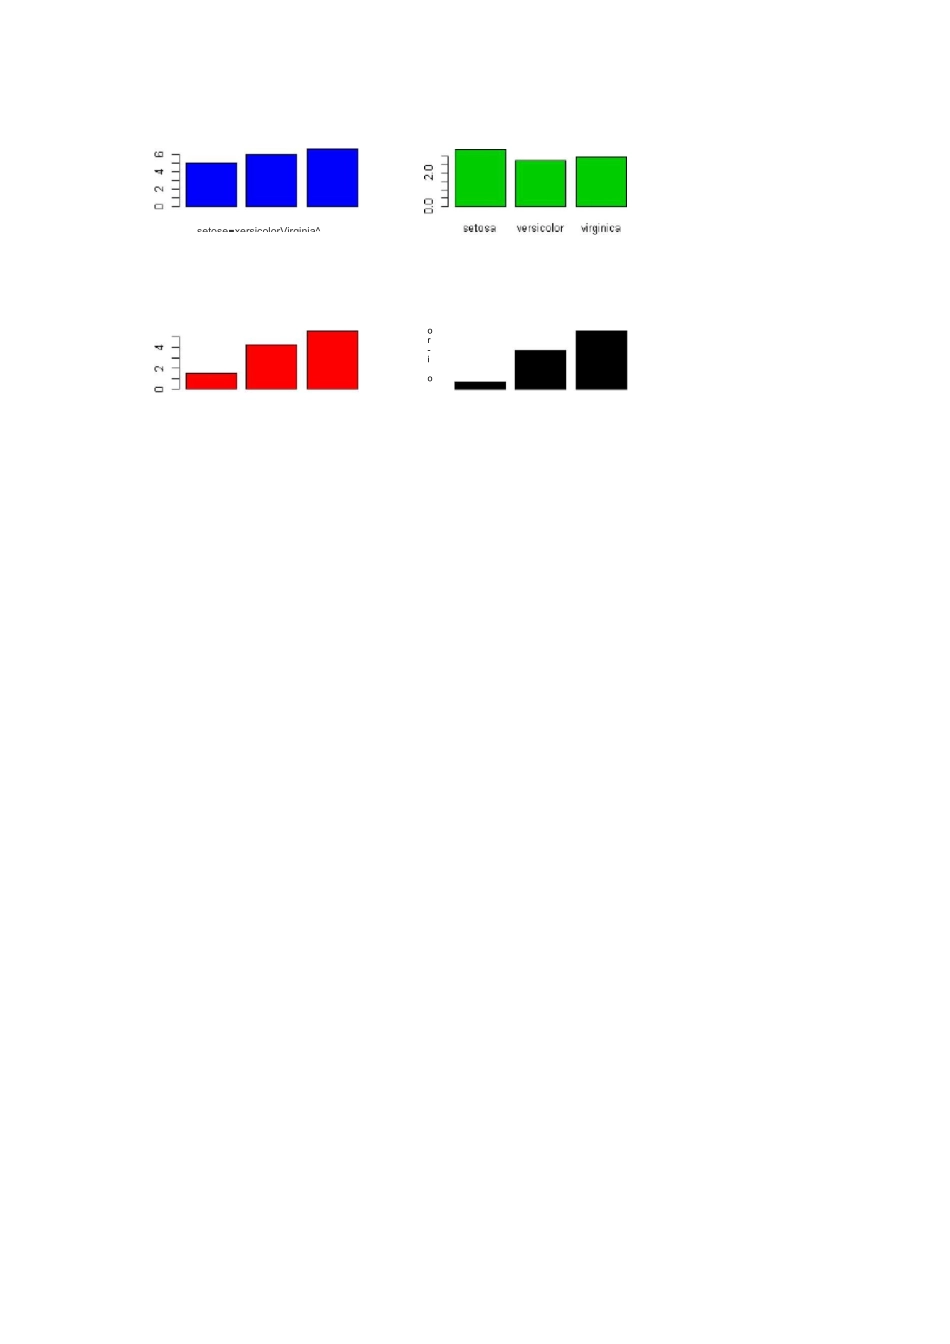
> height5 barplotCheights)setosaversicolorvirginica2•用每类花的Sepal
Length、Sepal
Width、Petal
Length、Petal
Width 的平均值分别制作条形图,四图同显
> barplotCtapplyCSepal・L^ngth,^口已匚厲已^‘⑴ 已日和),f 口1=4)abarplotCtapplyCSepal
NrcIth’SpE 匚厲已耳,5 已日门) barplot(tappl/(petal・I_E 门gth,5 卩已:彳已3,厲已日门)
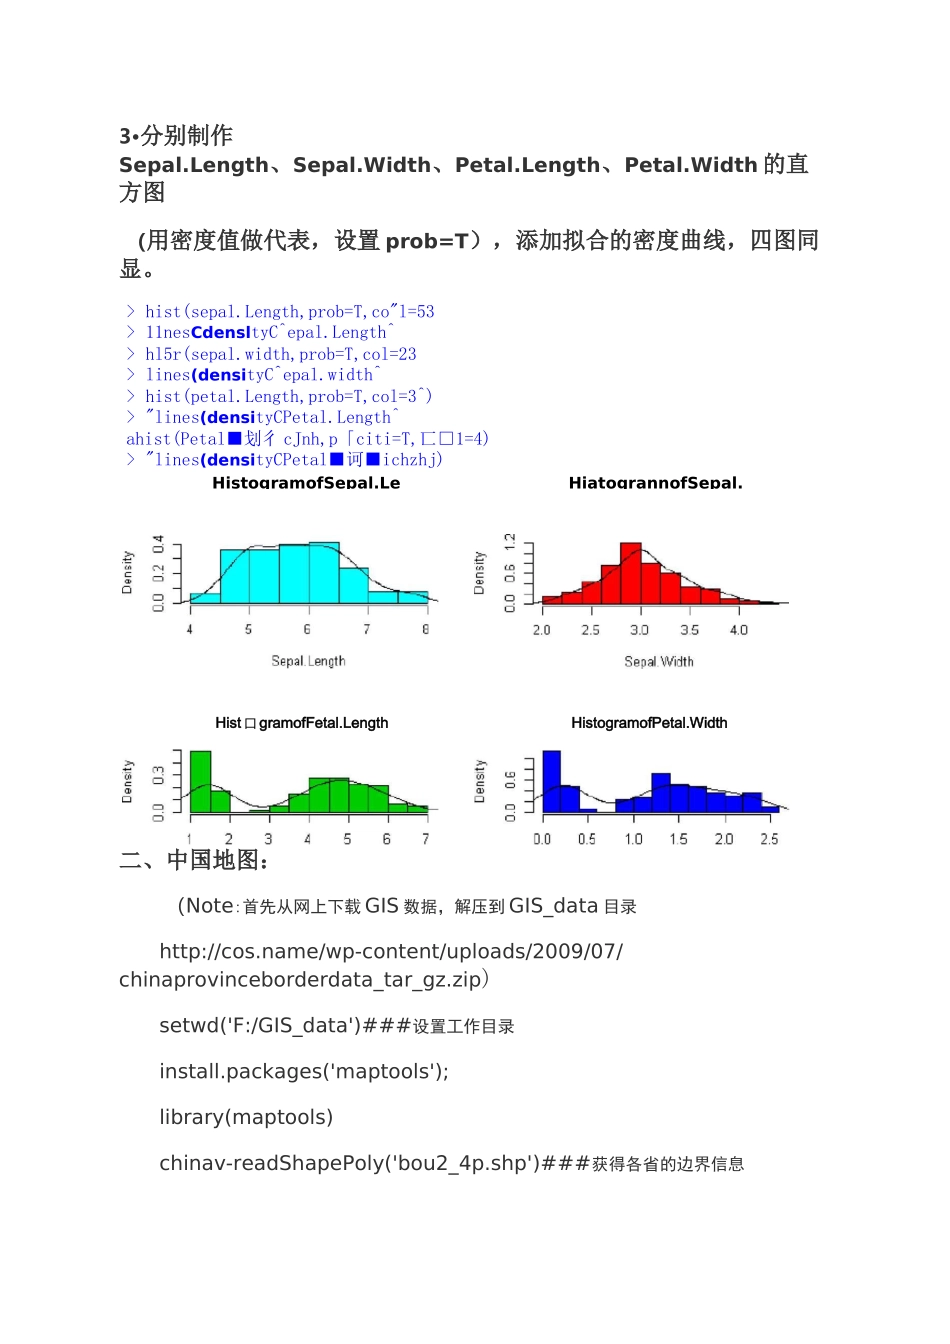
匚口1=2)abarplot(tappl/(petal■训rch:h,2pE 匚 b,rriEarQ,©cd=1)osetose■xersicolorVirginia^or-io3•分别制作Sepal
Length、Sepal
Width、Petal
Length、Petal
Width 的直方图(用密度值做代表,设置 prob=T),添加拟合的密度曲线,四图同显
> hist(sepal
Length,prob=T,co"l=53> 11nesCdensltyC^epal
Length^> hl5r(sepal
width,prob=T,col=23> lines(densityC^epal
width^> hist(petal
Length,prob=T,col=3^)> "lines(densityCPetal
Length^ahist(Petal■划彳 cJnh,p「citi=T,匸□1=4)> "lines(densityCPetal■诃